? GBP/USD Bullish Breakout Testing 78.6% Fib at 1.32 ?
Subscribe
Hi traders,
The GBP/USD is showing a bullish continuation after breaking above the resistance trend line (dotted red) but price is now approaching deeper Fibonacci retracement levels that could act as potential resistance.
GBP/USD
4 hour
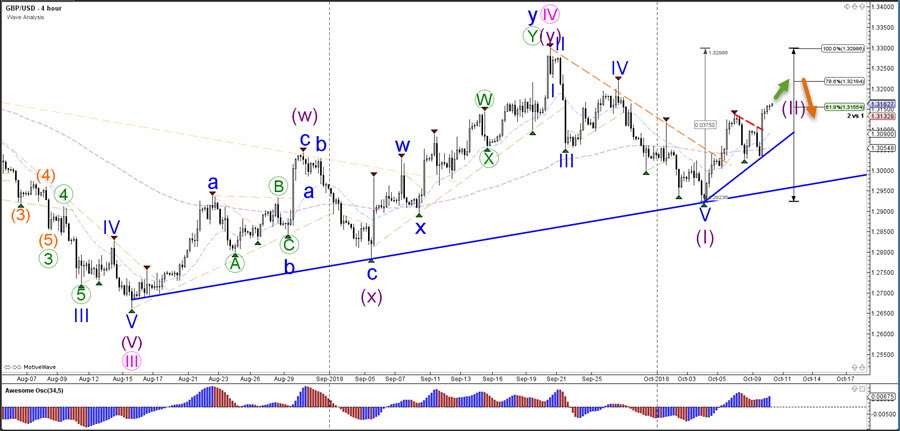
The GBP/USD is probably in a wave 1-2 (purple) pattern, although the 5 waves within wave 1 (purple) are not that clear and could also be an ABC pattern. A break above the 100% Fibonacci level invalidates the wave 1-2 (purple) and indicates that a wave 4 (pink) is still ongoing whereas a break below the support trend line (blue) indicates a bearish breakout.
1 hour
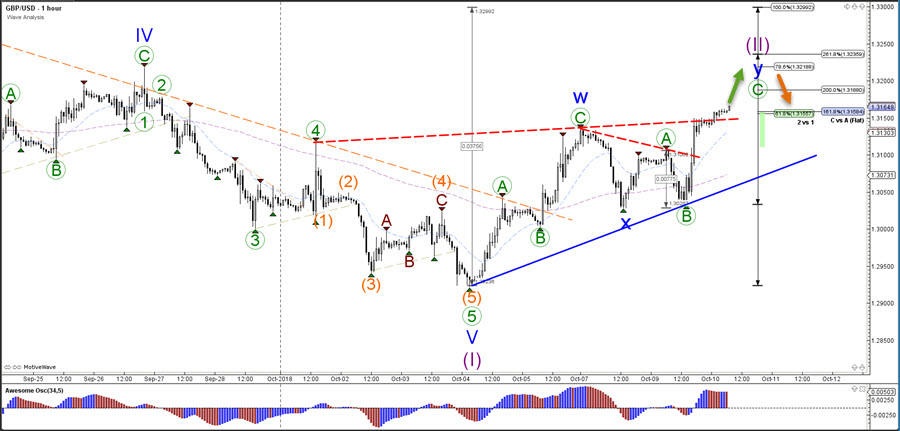
The GBP/USD seems to be building an ABC (green) pattern within wave 2 (purple). The Fibonacci retracement levels of wave 2 (purple) are key levels for a bearish bounce or reversal.
Good trading,
Chris Svorcik
Elite CurrenSea


Leave a Reply