? GBP/USD Bearish ABC Pattern Within Final Wave E Triangle ?

Dear traders,
the GBP/USD made a bearish bounce at the 61.8% Fibonacci level, which seems to confirm the wave D of a larger contracting triangle pattern.
GBP/USD
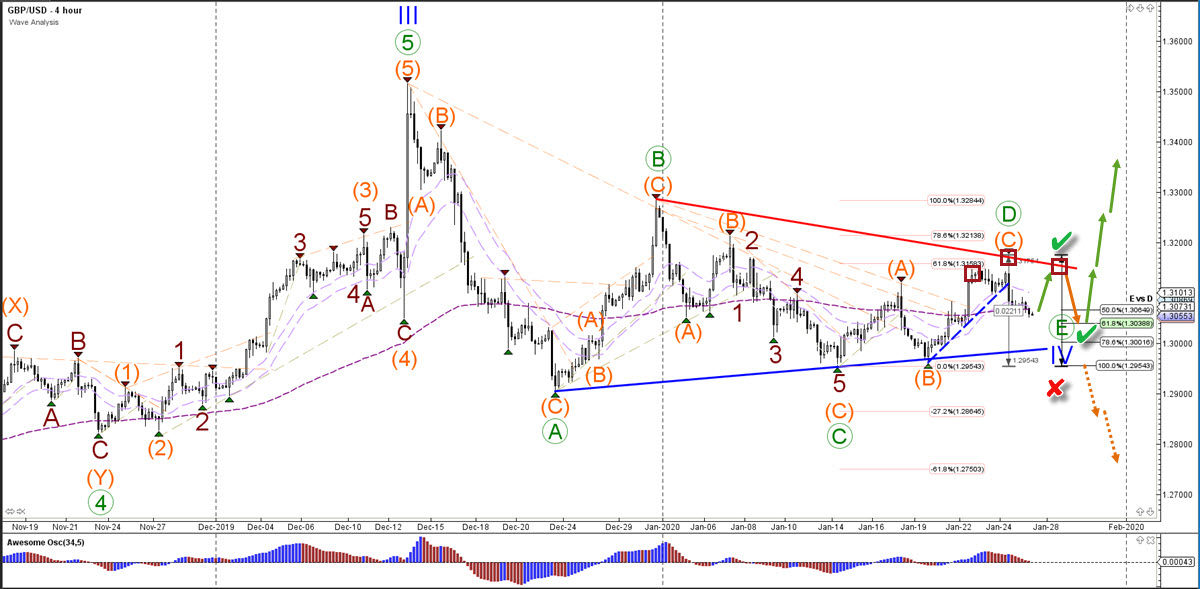
4 hour
The GBP/USD completed a bullish ABC (orange) zigzag pattern near 1.32 within the expected wave D (green). A bearish price swing is now expected and if the triangle pattern holds, then price action could build a bearish ABC pattern within wave E. Price should not break below bottom otherwise the pattern is invalidated (red x). For the moment, price action could retest the resistance (red) trend line again and build a head and shoulders (red boxes) reversal chart pattern with a target at the 61.8% or 78.6% Fibonacci levels of wave E vs D.
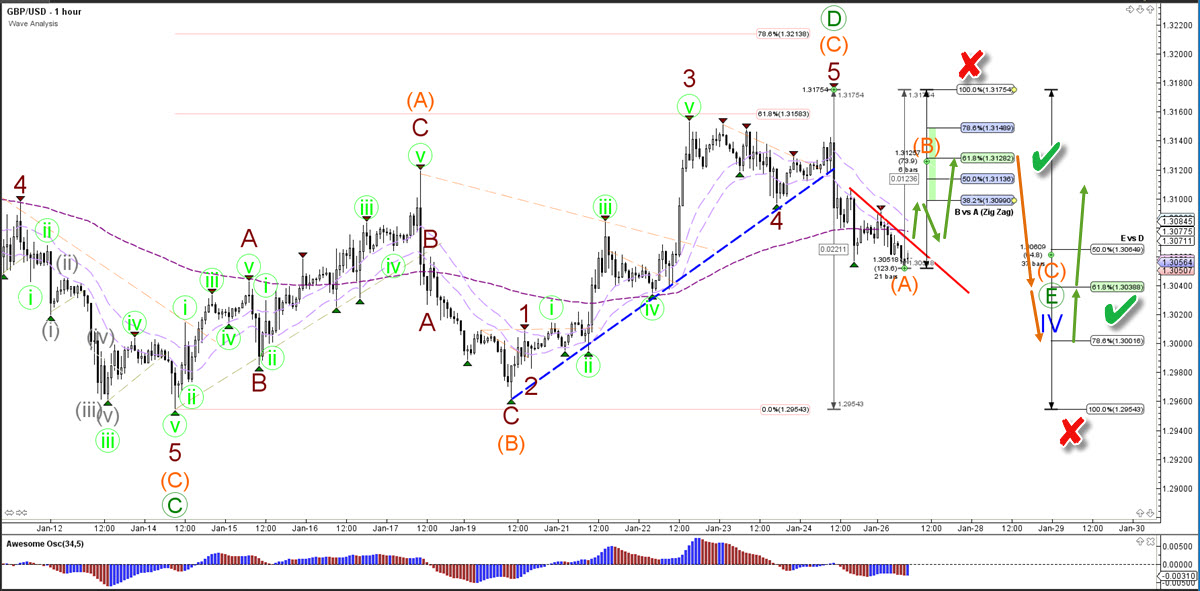
1 hour
The GBP/USD completed a wave 4-5 (dark red) pattern within wave C (orange) after building a reversal and bearish breakout below the support trend line (dotted blue). Price seems to have completed, now or soon, a wave A (orange) of a larger bearish ABC (orange) pattern. A bullish ABC zigzag could take price back up for wave B (orange) as long as the price stays below the 100% Fib (red x).
The analysis has been done with SWAT method (simple wave analysis and trading).
For more daily technical and wave analysis and updates, sign-up up to our newsletter.
Good trading,
Chris Svorcik
Elite CurrenSea


Leave a Reply