? GBP/USD ABC Sideways Range Indicates Volatility ?
Subscribe
Hi traders,
the GBP/USD is building a sideways zone, which could turn out to be an ABC correction or eventually even an ABCDE triangle pattern. The Cable needs a clear break below or above the zone to confirm the next direction.
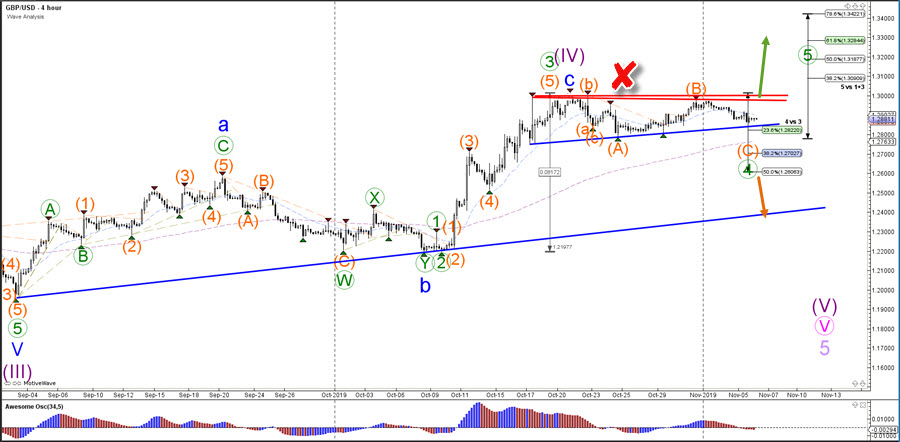
GBP/USD
4 hour
The GBP/USD bullish breakout (green arrow) would aim for the Fibonacci targets of wave 5 vs 1+3 and also invalidate (red x) the wave 4 (purple) pattern. A bearish breakout needs to push below the 38.2% Fib of wave 4 vs 3 before a larger reversal becomes likely.
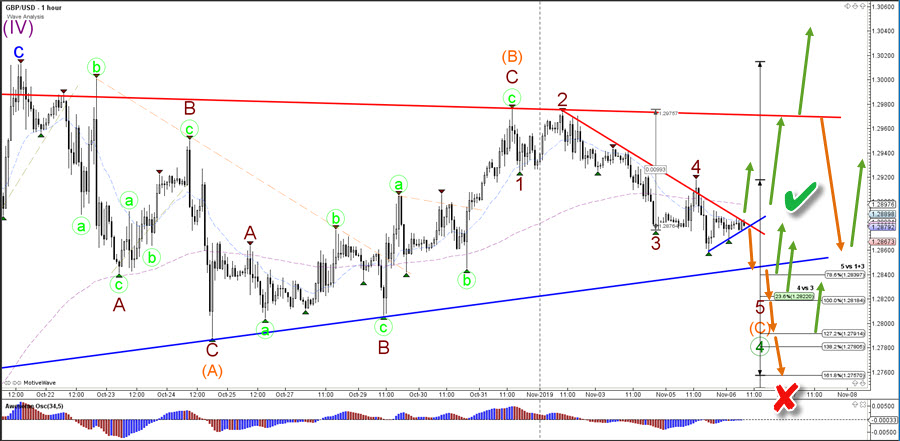
1 hour
The GBP/USD wave analysis prefers a bullish bounce at the support zone (blue) to complete the wave C (orange) of the ABC correction. A mild bullish bounce could indicate the development of an ABCDE triangle pattern instead. A bearish breakout could send the price towards the Fibonacci level support. If price breaks below 1.2750 then this could indicate larger bearish reversal and the wave 4 (green) is not invalidated but does become less likely (red x). Any bullish breakout (green check) could send the Cable higher towards the resistance line (red).
For more daily wave analysis and updates, sign-up up to our ecs.LIVE channel.
Good trading,
Chris Svorcik
Elite CurrenSea


Leave a Reply