🚀 GBP/JPY Bull Flag in Uptrend But Running Out of Steam 🚀
June 11, 2021
4 min read

Dear traders,
the GBP/JPY has been showing very strong bullish momentum. But it might be time for a pullback with a divergence pattern visible on the daily chart.
This article will review the Elliott Wave and Fibonacci patterns and discuss the main scenarios for the upcoming weeks.
Price Charts and Technical Analysis
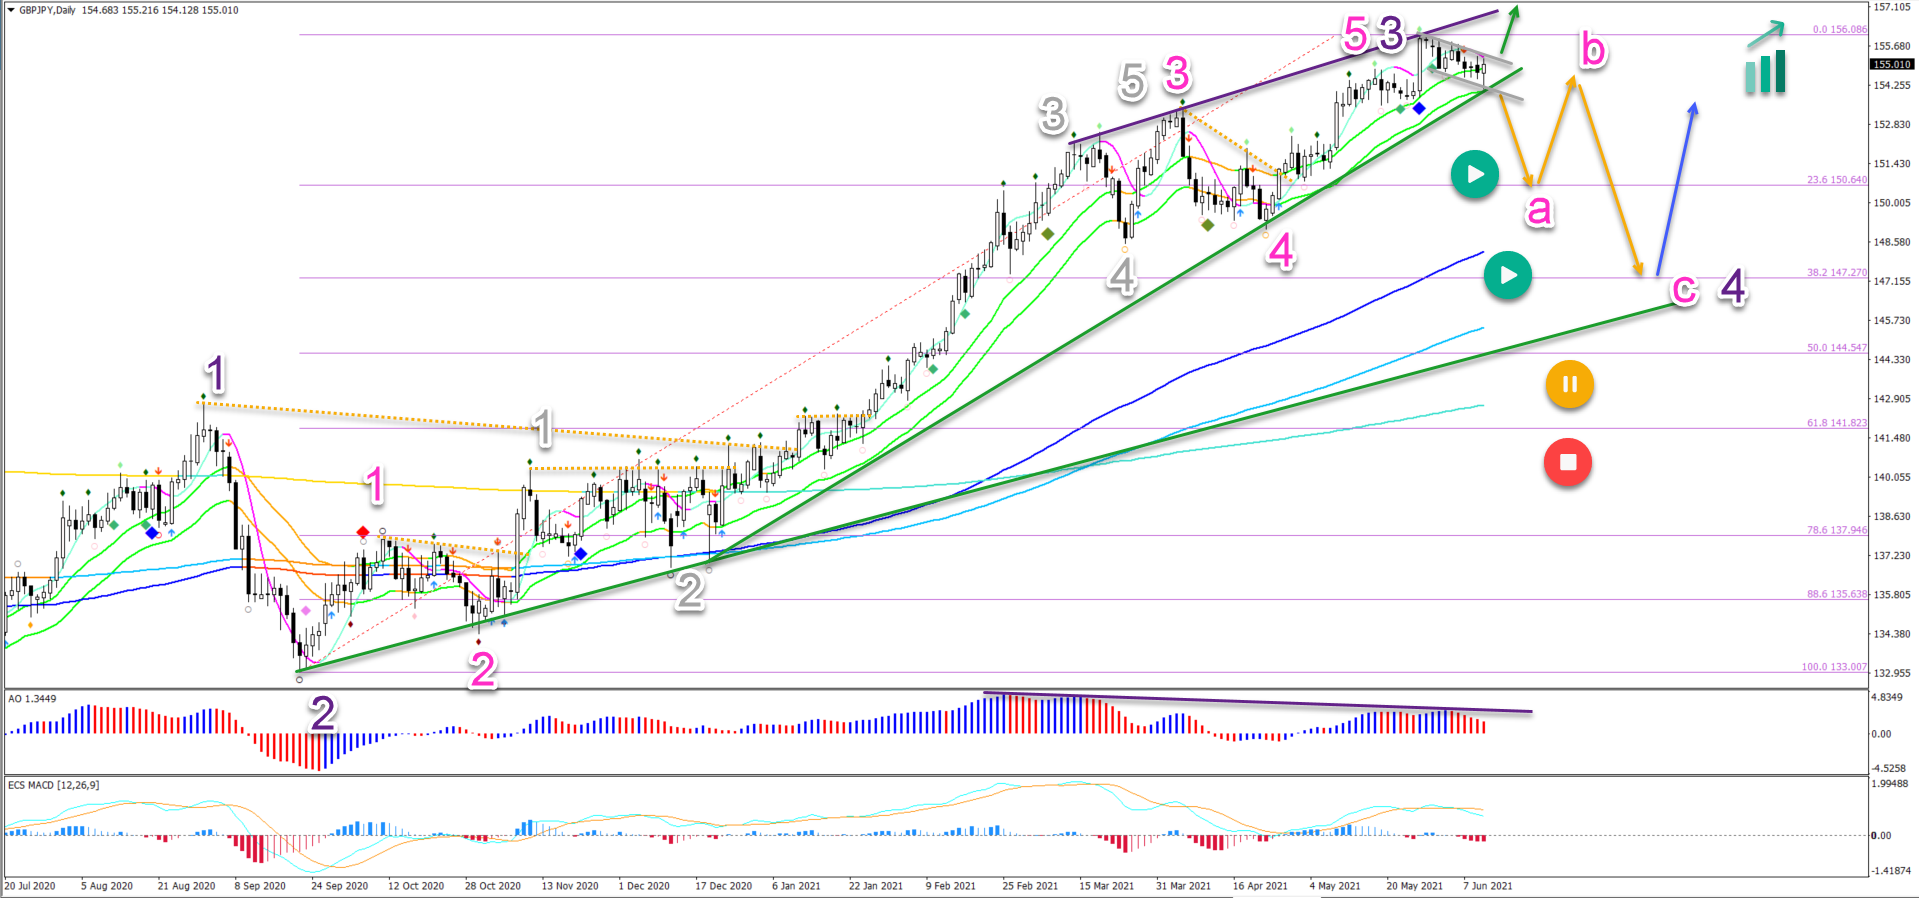
The GBP/JPY bullish impulse is typical for a wave 3 (purple) impulse:
- The divergence pattern between the tops (purple lines) is indicating the uptrend is running out of steam. A reversal might occur now or soon.
- A bullish breakout above the smaller bull flag chart pattern, however, could indicate one more push up (green arrows) and a higher high.
- The main bullish targets are located at the 157.25-50 and 159.35-160 target zones.
- Whereas a bearish breakout (orange arrows) below the support trend line (green) and the 21 ema support zone could indicate a bearish retracement.
- The retracement is expected to create a bearish ABC (pink) pattern and is aiming at the Fibonacci retracement levels of wave 4 (purple).
- The most common Fibonacci Fibonacci levels are the 23.6% and 38.2% where a bullish bounce (bullish arrow) is expected.
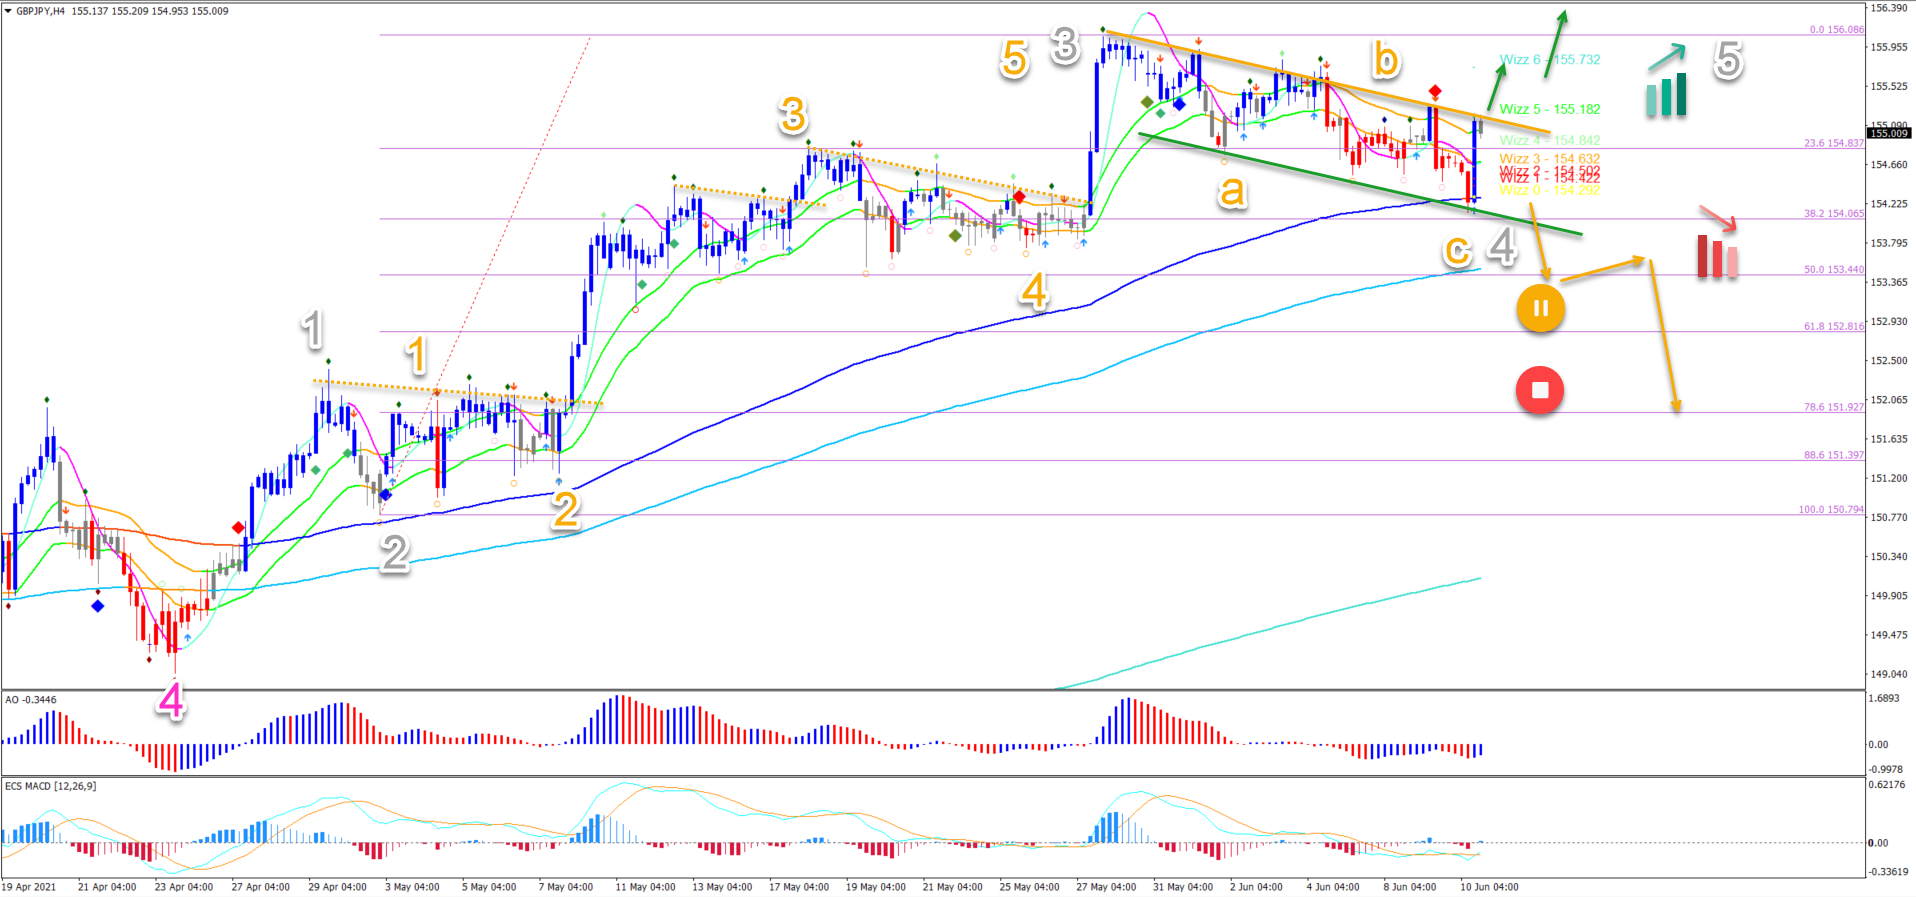
On the 4 hour chart, price action is still in an uptrend because the price is above the 21 ema zone, which is above the 144 ema, 233 ema, and 610 ema:
- The bull flag chart pattern indicates the potential for more upside before the divergence pattern on the 4 hour and daily charts has an impact.
- A breakout above the flat (green arrows) could confirm the uptrend and the wave 4-5 (grey) pattern.
- Price has already made a bounce at the 38.2% Fibonacci level. But a break below it could indicate a reversal instead (orange arrows).
- The odds of a bearish or bullish breakout seem to be about 50-50% so waiting for the actual breakout to take place could make sense.
- With a bearish breakout, the larger bearish retracement on the daily chart could begin.
The analysis has been done with the indicators and template from the SWAT method (simple wave analysis and trading). For more daily technical and wave analysis and updates, sign-up to our newsletter.
Good trading,
Chris Svorcik


Leave a Reply