✅ EUR/USD Impulsive Price Action Creates Bullish ABC Zigzag ✅
Subscribe
Hi traders,
The EUR/USD bounced at the bottom of the triangle pattern and made a strong and impulsive bullish reversal back to the top and resistance zone of the same corrective chart pattern.
EUR/USD
4 hour
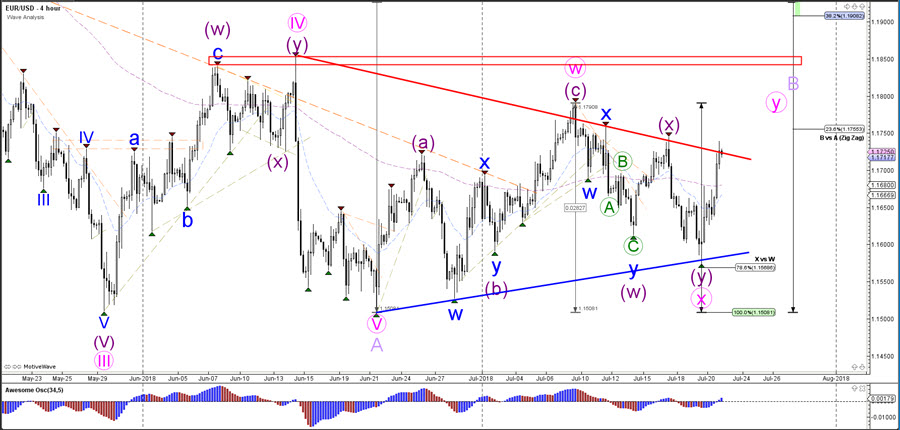
The EUR/USD has reached a decision zone where a bullish breakout could see price move up towards the previous top (red box) whereas a bearish pullback could see price move towards the Fibonacci levels of wave B as mentioned on the 1 hour chart.
1 hour
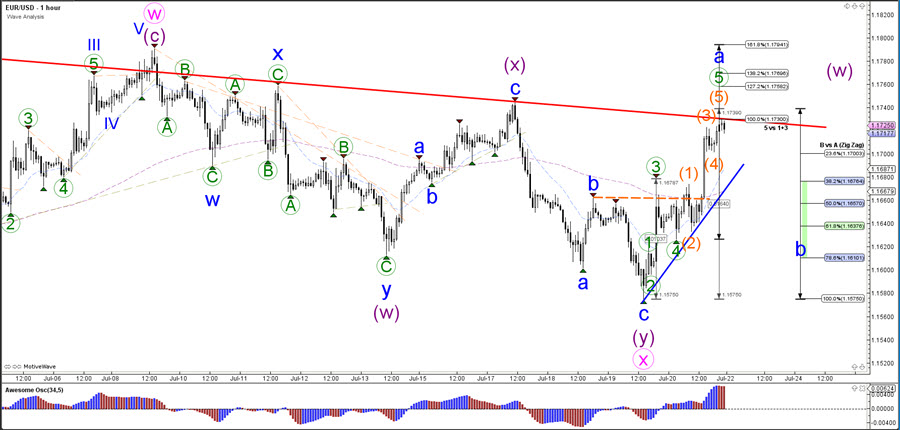
The EUR/USD seems to be completing 5 waves (orange) within a 5th wave (green) of wave A (blue). A bearish bounce could indicate a pullback to the Fibonacci levels of wave B (blue), which could act as potential support levels. A shallow and corrective pattern at this point could indicate a wave 4 correction rather than a wave B (with wave 3 finishing at the recent high). A break below the bottom of wave B (100% level) invalidates the bullish ABC potential.
Good trading,
Chris Svorcik
Elite CurrenSea


Leave a Reply