💪 EUR/USD Bulls & Bears Fight for Control at Decision Zones 💪


Dear traders,
the EUR/USD made a break and bounce above the 21 ema zone. Price action could now be in a wave 3 or C pattern.
But price action will need a breakout to confirm the uptrend… because otherwise a reversal is still possible.
This article reviews the key decision zones for the uptrend continuation. We also analyse what-if scenarios during a potential bearish turn around and breakout.
Price Charts and Technical Analysis
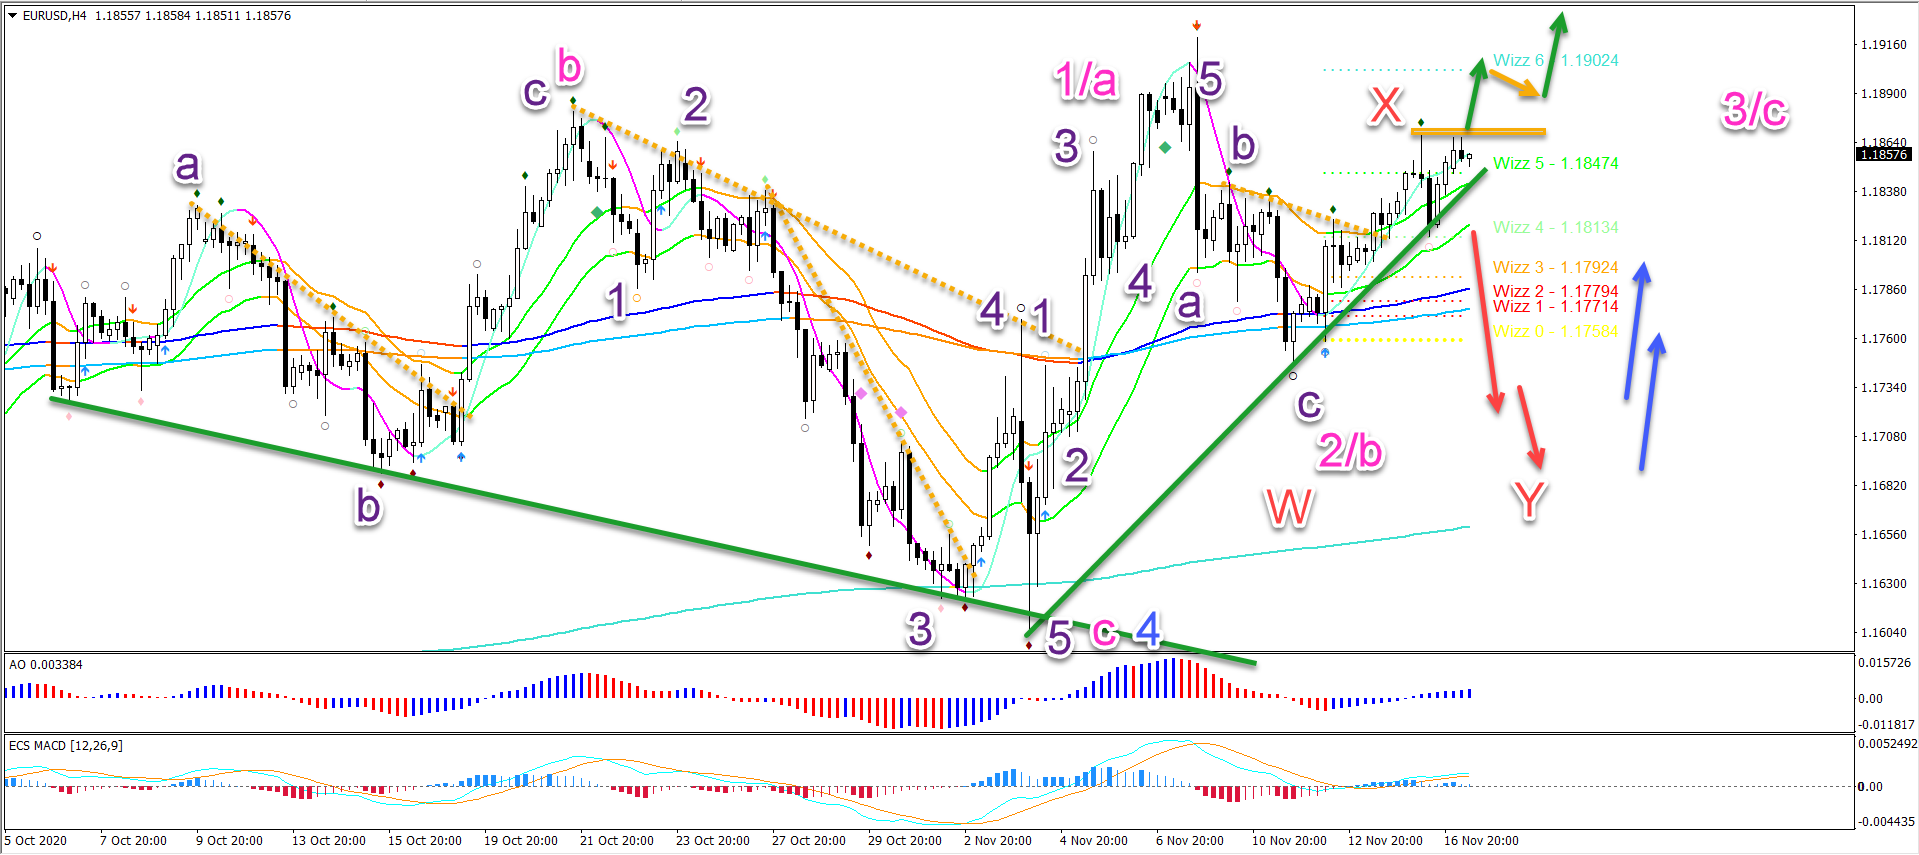
The EUR/USD seems to have completed 5 waves (purple) up as part of either a wave 1 or A (pink). This was followed by an expected ABC pattern (purple).
The main question is whether the ABC pattern has already completed the wave 2 or B (pink). Or will there be an expanded WXY (red) correction with one more swing lower (red arrows).
The key decision zones are the resistance fractal (orange line) and support trend line (green). A breakout above or below the S&R should confirm the direction of the next price swing.
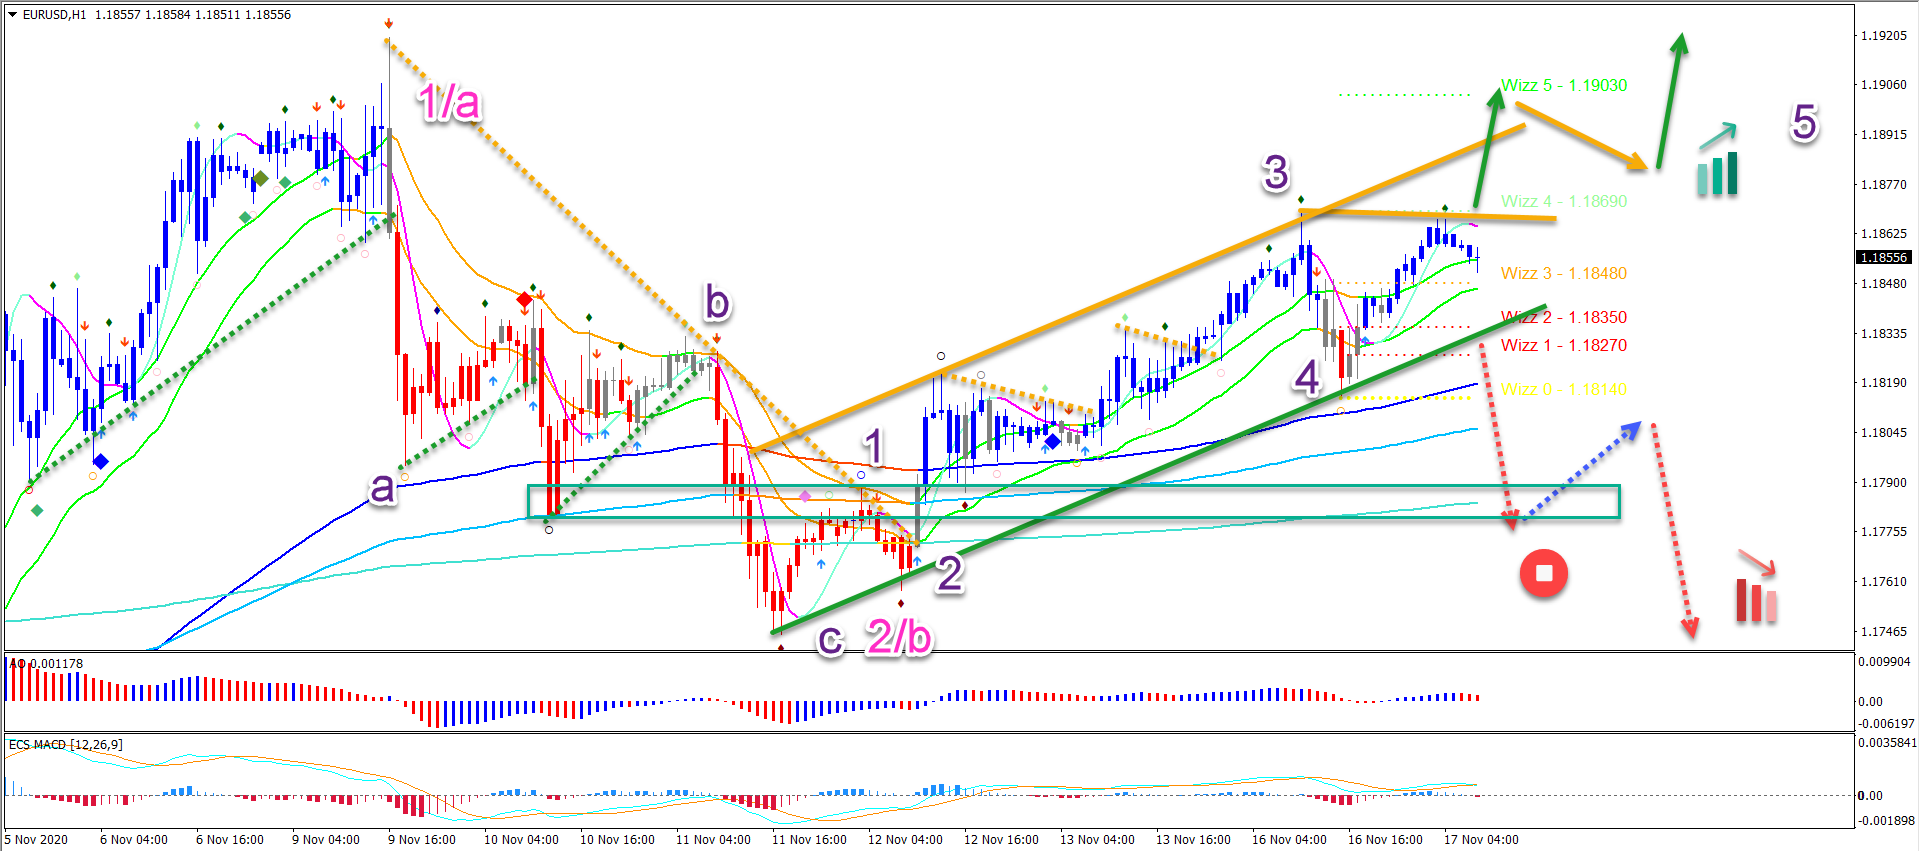
On the 1 hour chart, price action managed to rebreak above the 21 ema zone. Now price action needs to also close above the two Fractals to confirm the uptrend (green arrows). A bearish breakout invalidates the bullish wave outlook in this image. This could be a first indication of a deeper retracement (red dotted arrows) on the higher time frames.
The analysis has been done with the indicators and template from the SWAT method (simple wave analysis and trading). For more daily technical and wave analysis and updates, sign-up to our newsletter.
Good trading,
Chris Svorcik


Leave a Reply