? EUR/USD Bullish Pullback Testing Key 1.09-1.10 Resistance Zone ?

Dear traders,
the EUR/USD made a new lower low. But price has reached or is close to hitting the 88.6% Fibonacci support. Will price bounce at support?
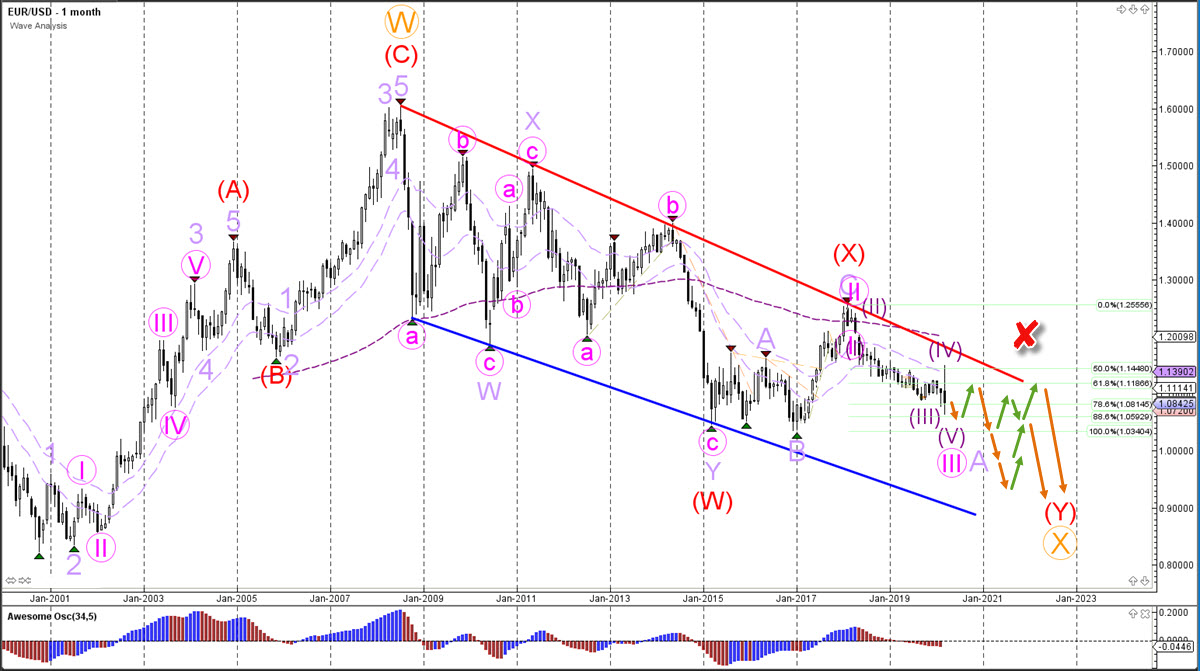
EUR/USD
Monthly chart
The EUR/USD is likely to see a retracement. But the overall picture is bearish. After a pullback the EUR/USD looks ready for a decline within the downtrend channel. Price seems to be completing a 5 wave pattern within wave A (light purple) of a larger ABC correction.
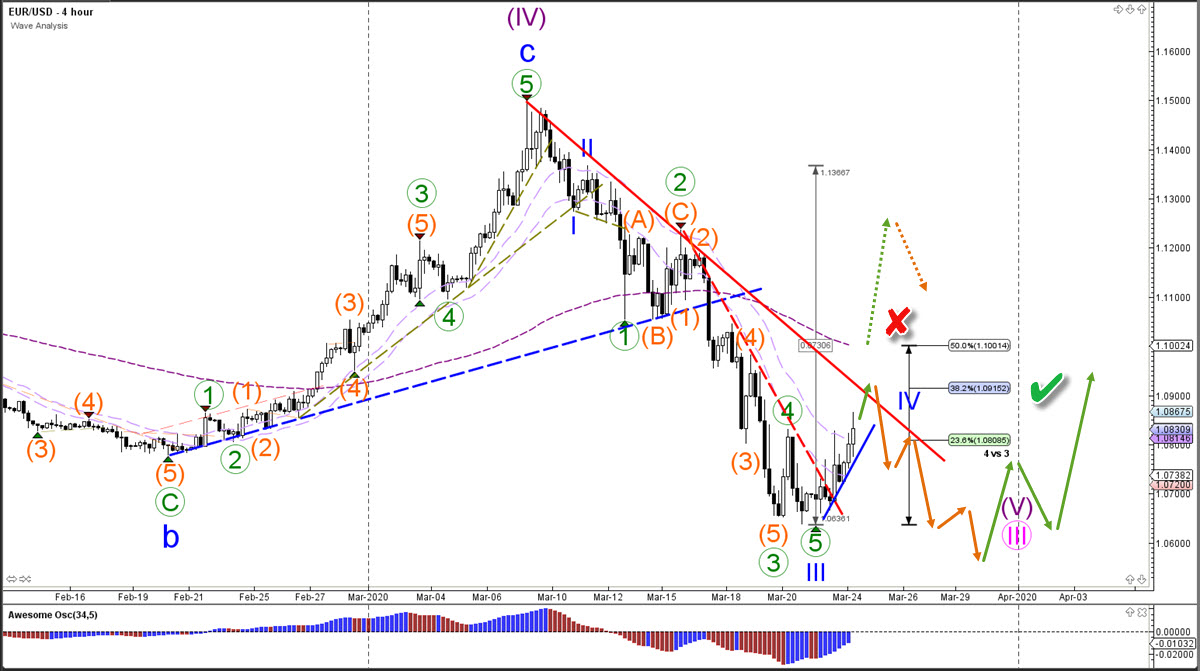
4 hour chart
The EUR/USD showed strong bearish momentum. Price is probably in a wave 3-4 (blue) pattern. This is invalid (red x) if price action breaks above the 50% Fibonacci retracement. A bearish bounce at the Fibonacci levels of wave 4 vs 3 could confirm (green check) the downtrend continuation. The main target of a bearish decline is at 1.06 and perhaps as low as 1.05.
The analysis has been done with SWAT method (simple wave analysis and trading).
For more daily technical and wave analysis and updates, sign-up up to our newsletter.
Good trading,
Chris Svorcik
Elite CurrenSea


Leave a Reply