? EUR/USD Break in Uptrend Channel Aims at 1.15 ?
February 21, 2019
3 min read
Subscribe
Hi traders,
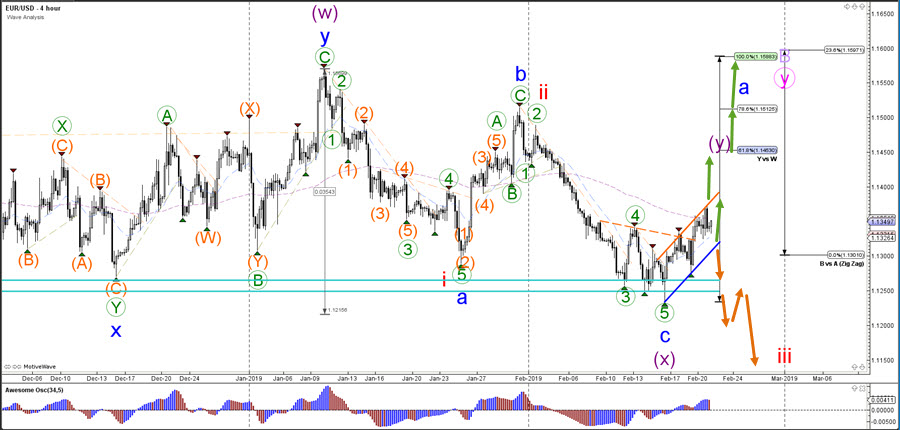
the EUR/USD is showing a bullish trend channel and price is struggling to break above its resistance trend line (orange). A bullish breakout, however, could confirm a larger wave A (blue) pattern and a continuation towards the Fibonacci levels of wave Y vs W (purple).
EUR/USD
4 hour
The EUR/USD made a bullish bounce / reversal at the 1.1250 round level support zone (blue horizontal lines) and has also broken above the local resistance trend line (dotted orange). This could indicate an ABC (blue) zigzag correction within wave B (purple) as long as price remains above the support levels. A bearish breakout could however indicate a downtrend.
1 hour
The EUR/USD seems to be completing a second wave 1-2 (orange) pattern after finishing a wave 1-2 (green) earlier. Eventually price will need to show an impulsive breakout in order to confirm a wave 3 (orange) pattern. A break above the resistance trend line (orange) could indicate a push higher towards the Fibonacci targets of wave 3 vs 1 such as 1.15, whereas the Fib levels of wave 2 vs 1 remain potential support.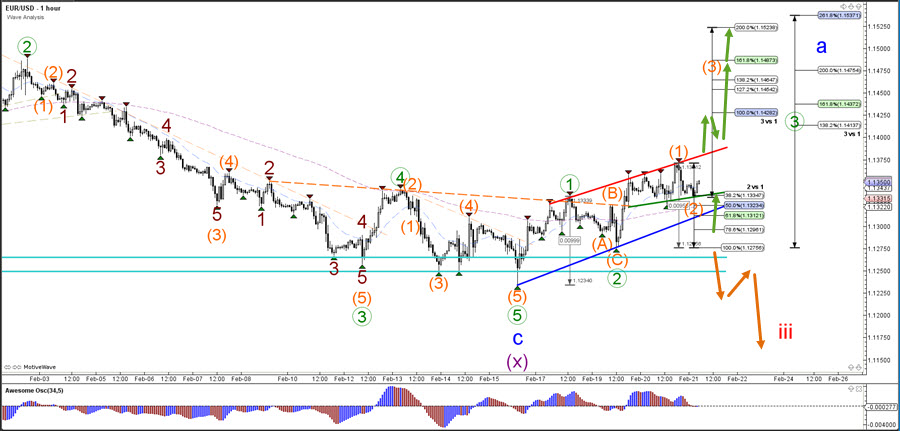
For more daily wave analysis and updates, sign-up up to our ecs.LIVE channel.
Good trading, Chris Svorcik


Leave a Reply