? EUR/USD Bearish Impulse Favors Downtrend Continuation ?
Subscribe
Dear traders,
the EUR/USD showed a strong bearish bounce at the 1.11 resistance zone and a breakout below support remains most likely at the moment.
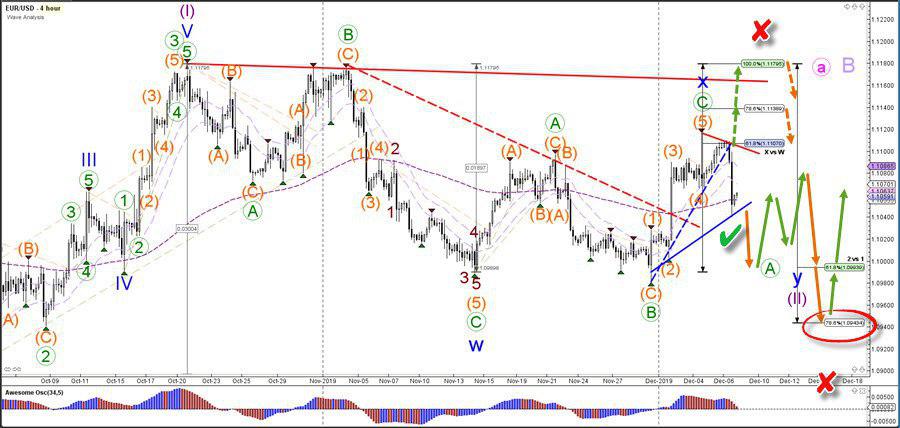
EUR/USD
4 hour
The EUR/USD breakout below the support (blue) trend line could confirm (green check) a bearish continuation towards the Fibonacci retracement levels of wave 2 vs 1 (purple). The 78.6% Fibonacci level (red circle) is the main bouncing spot for a bullish reversal. But the price stays above the bottom of wave 1 otherwise the wave 1-2 is invalidated (red x at bottom). A push above the resistance levels (red) could indicate that the current complex WXY (blue) correction will not continue lower (red x top).

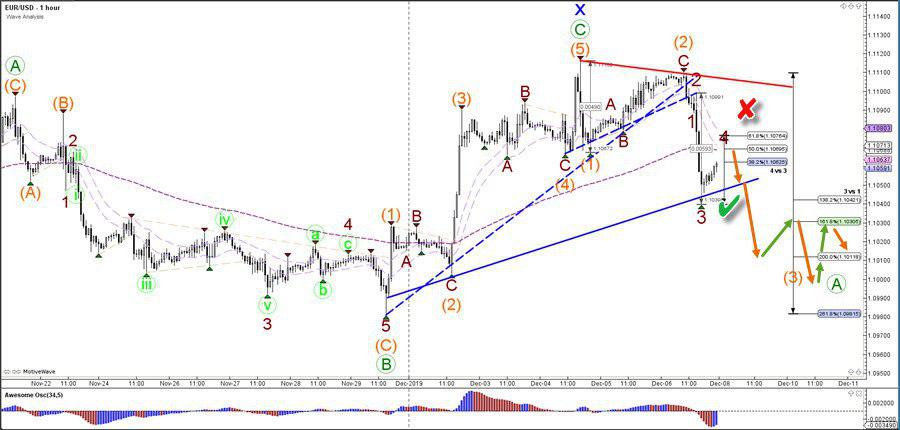
1 hour
The EUR/USD is probably building a wave 4 (dark red) pullback as long as the price stays below the 61.8% Fibonacci retracement level otherwise the current wave outlook is invalidated (red x). A break below the support (blue) trend line confirms (green check) a bearish breakout towards the Fibonacci levels of wave 3 vs 1. The 5 wave pattern could complete a wave A (green).

For more daily wave analysis and updates, sign-up up to our ecs.LIVE channel.
Good trading,
Chris Svorcik
Elite CurrenSea


Leave a Reply