🔍 EUR/USD Analysis Today Including Key Price and Chart Patterns 🔍


Dear traders,
the EUR/USD is building a bullish bounce at the 38.2% Fibonacci retracement level, the 1.20 support zone, and the 144 and 233 ema area as expected in our EUR/USD video analysis.
This article will analyse the main targets for this bullish bounce. We will also take a look when to expect the next bearish price swing.
Price Charts and Technical Analysis

The EUR/USD seems to have completed a bearish wave A (grey) at the support zone. This occurred after price action completed 5 waves up (grey) within wave A (pink):
- The wave A (grey) is probably part of a larger bearish ABC zigzag (grey).
- The ABC (grey) pattern is expected to complete a wave B (pink).
- The main target for the wave B (grey) is around the Wizz level 5 at 1.21. Here a bearish bounce is expected (orange arrows).
- The main target for the wave C (grey) of wave B (pink) is at the 61.8% Fibonacci retracement level near 1.1875 (blue box). Here a bullish bounce is expected (blue arrow).
- Both ABC zigzag patterns (grey and pink) are invalid if price action breaks the top too soon or the bottom.
On the 1 hour chart, we can see that the uptrend finished at the end of last week when price action broke below the 144 ema. Prior to the break, the 144 ema acted as a strong support zone. With the bearish breakout, a bearish retracement sent price action lower.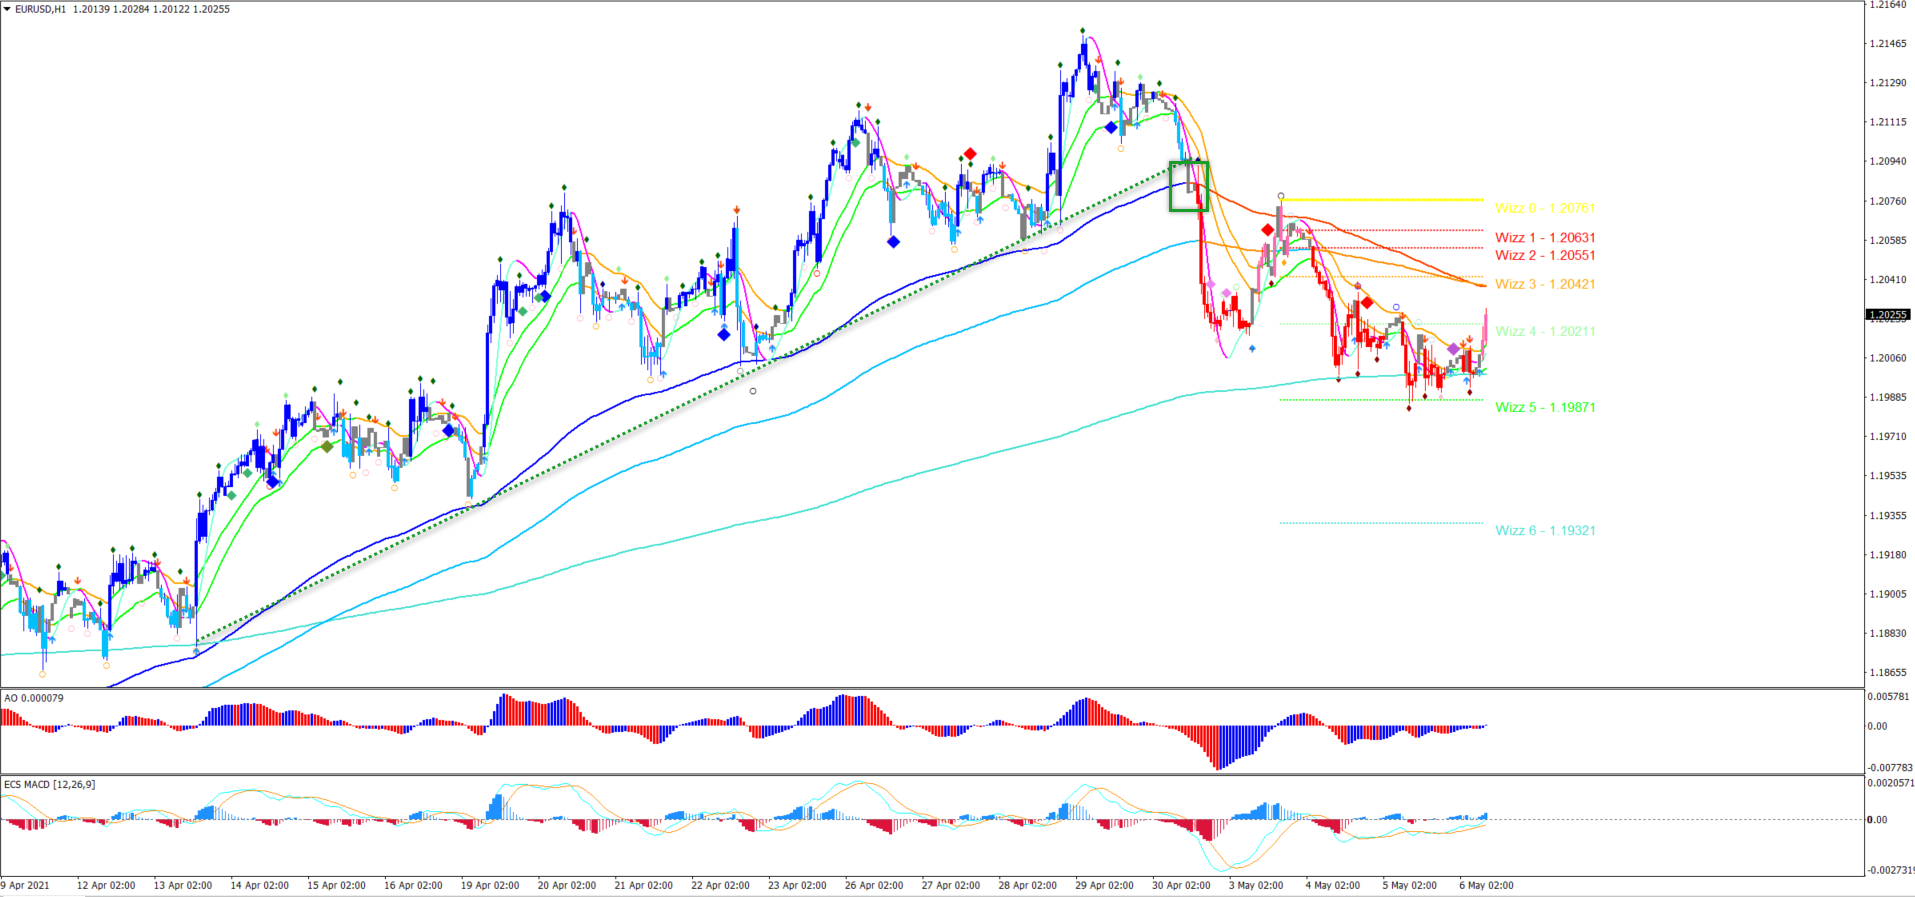
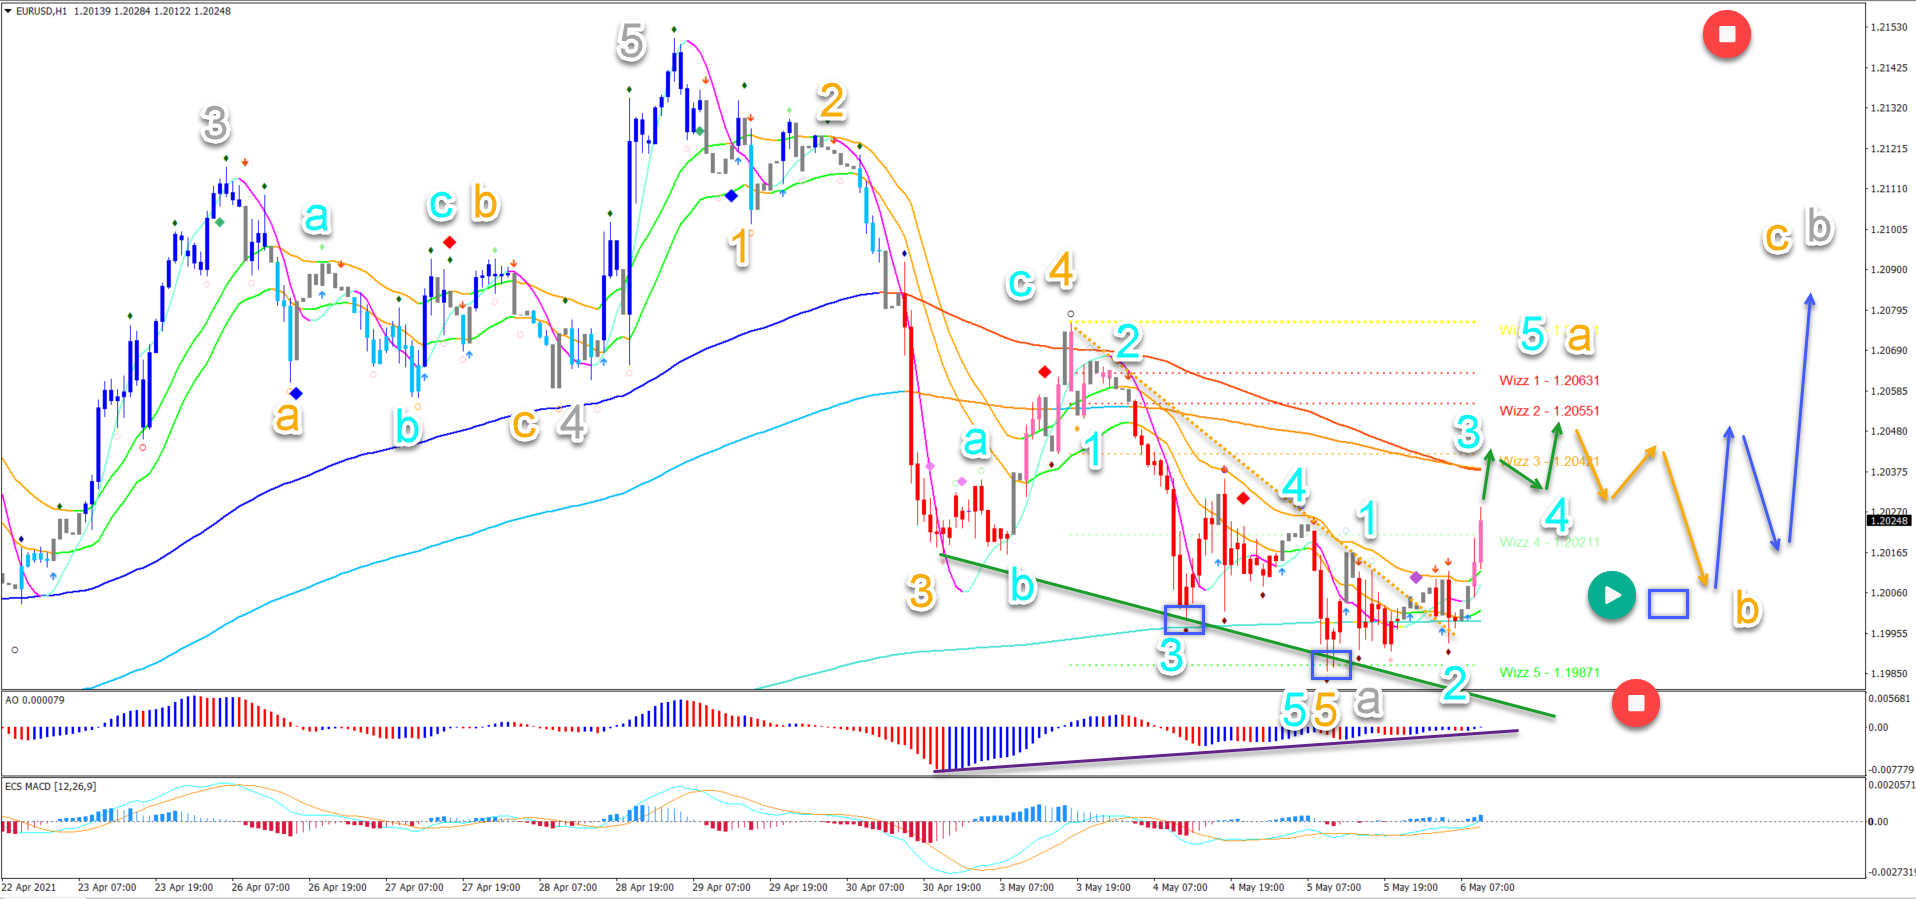
On the next 1 hour chart, we focus on the recent price swing and Elliott Wave patterns:
- A bearish 5 wave (blue) has been completed in the 5 wave pattern (orange).
- A falling wedge reversal chart pattern confirmed the end of the bearish price swing.
- Also the divergence pattern (purple) indicated exhaustion for the bears.
- A bullish breakout above the resistance trend line (dotted orange) and the 21 ema zone confirmed a bullish price swing.
- Now the main target seems to be the 144 ema resistance If a bull flag chart pattern emerges, then a new higher high could complete a 5 wave up (blue) within wave A (orange).
- A bearish ABC could send price back down again to the support zone (blue box).
- An inverted head and shoulders pattern could end the wave B (orange) and start the wave C (orange).
- A break below the Wizz 5 level invalidates (red circle) the currently expected bullish ABC pattern.
The analysis has been done with the indicators and template from the SWAT method (simple wave analysis and trading). For more daily technical and wave analysis and updates, sign-up to our newsletter.
Good trading,
Chris Svorcik


Leave a Reply