? EUR/JPY, GBP/JPY Bearish Breakout, Pullback and Continuation Patterns ?
Subscribe
Hi traders,
The GBP/JPY made a bearish breakout below the support trend line (dotted green) which seems to be confirming a bearish wave C (orange).
GBP/JPY
Day
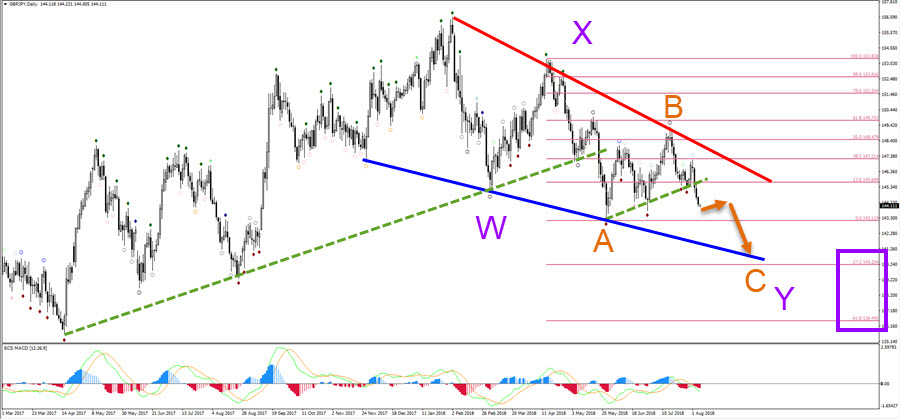
The GBP/JPY bearish break could fall and aim for the Fibonacci targets (purple boxes) of wave C vs A, which could complete a larger wave Y (purple). A break above the resistance trend line (red) would indicate a change of wave patterns.
4 hour
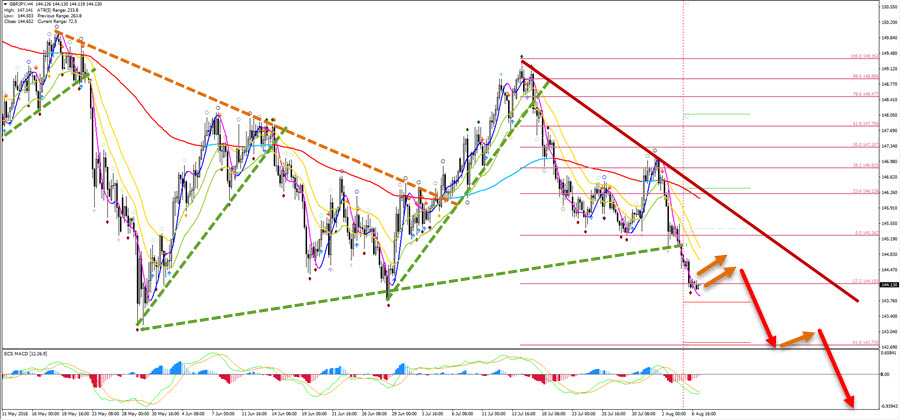
The GBP/JPY is showing strong bearish momentum after breaking below the support trend line (dotted green). A mild pullback (orange arrows) to the 21 ema moving averages could indicate a continuation setup for more downside (red arrows).
EUR/JPY
Day
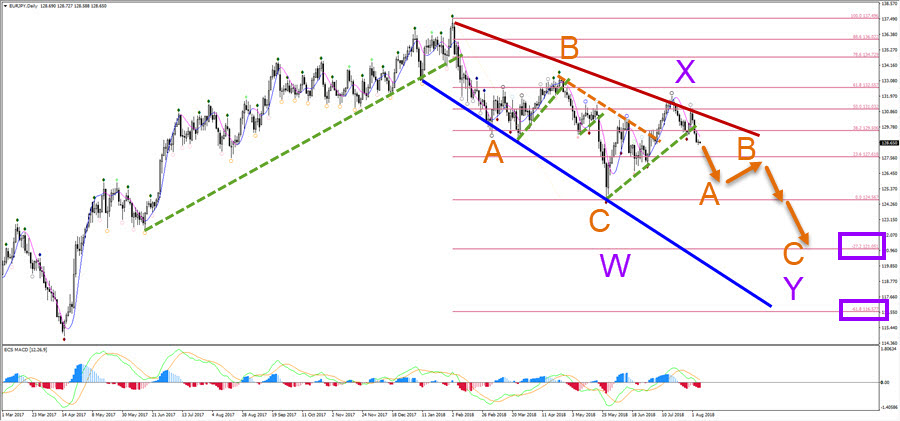
EUR/JPY has made a bearish bounce at the resistance trend line (dark red) and broken below the support trend line (dotted green). The wave pattern seems to be an extended WXY (purple) correction. Within wave Y (purple), price might build a new ABC zigzag pattern (orange arrows).
4 hour
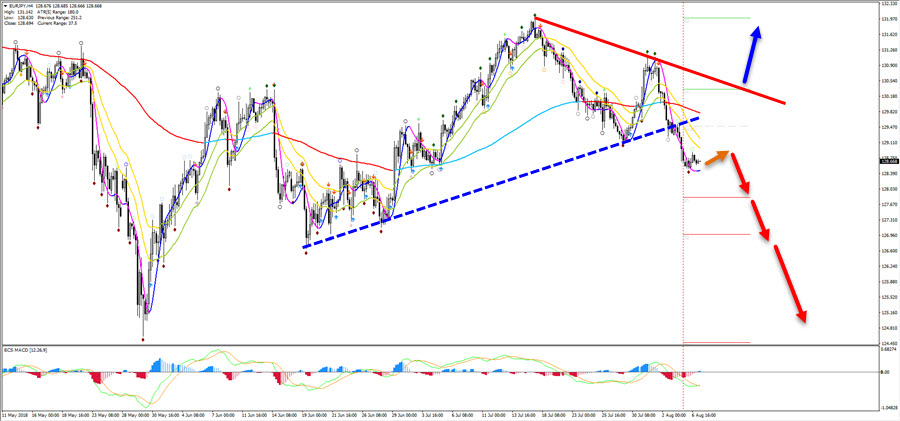
The EUR/JPY might make a shallow pullback to the short-term moving averages, which could be a resistance and bouncing spot for a downtrend continuation via the red arrows.
Good trading,
Chris Svorcik
Elite CurrenSea


Leave a Reply