? EUR/AUD Critical Bullish Breakout Above Bull Flag ?
Subscribe

Hi traders,
The EUR/AUD broke above the critical 21 ema zone and resistance trend line (dotted red) which could indicate a larger bullish breakout.
EUR/AUD
Week
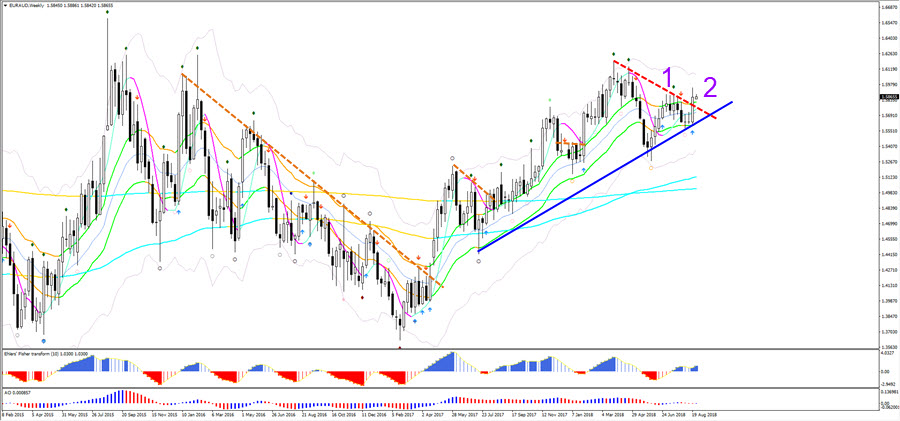
The EUR/USD is breaking for the second time above the 21 ema zone. The second break is often stronger and more reliable than the first breakout. A break below the 21 ema zone and support trend line (blue) could indicate a failed breakout.
Day
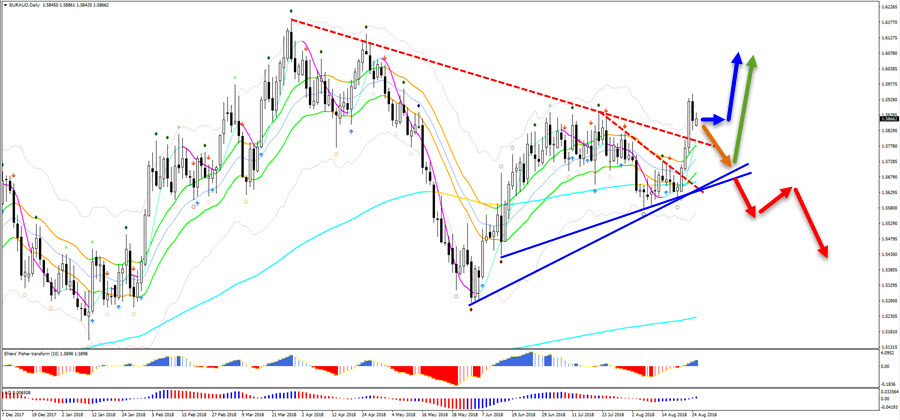
The EUR/AUD is trying to pull away from the 21 ema zone on the daily chart. If price manages to move higher without hitting the 21 ema, then price is considered to be in an impulsive swing.
4 hour
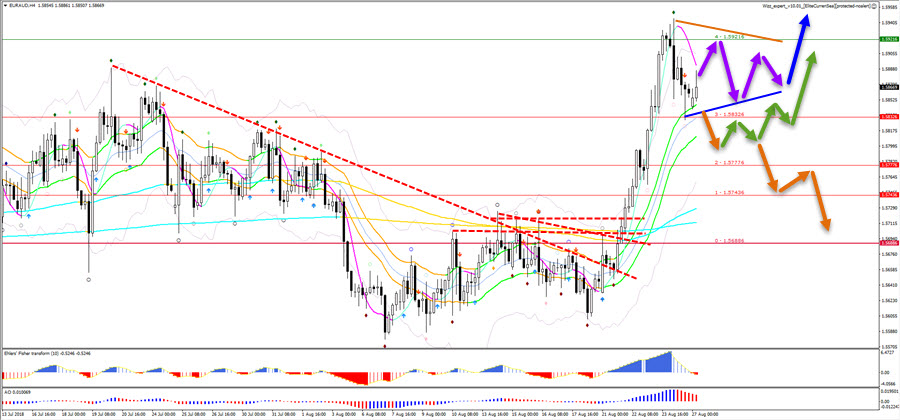
The EUR/AUD could build a sideways chart pattern at this point. A bullish breakout above the pattern could indicate an uptrend continuation. One break below the 21 ema zone could just be a retracement within the uptrend but if the EUR/USD breaks below the 21 ema again then a larger reversal could take place.
4 hour
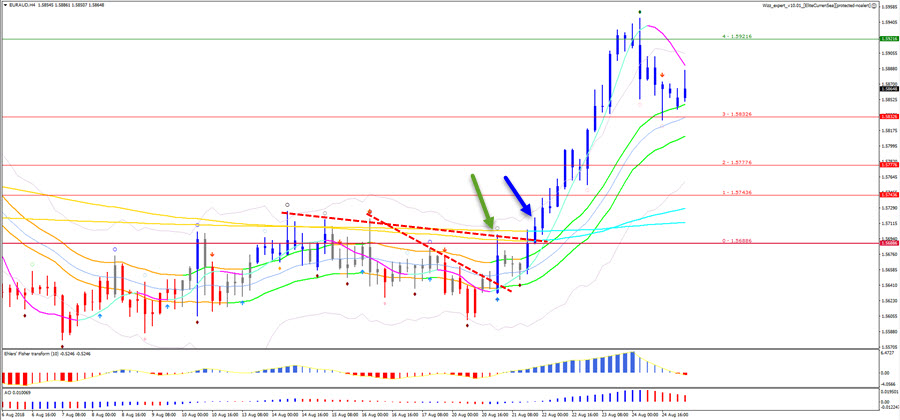
The EUR/AUD 4 hour chart but using the SWAT software and charts. The arrows indicate when the SWAT candles turned blue after breaking above the 21 ema zone and then the trend line.
1 hour
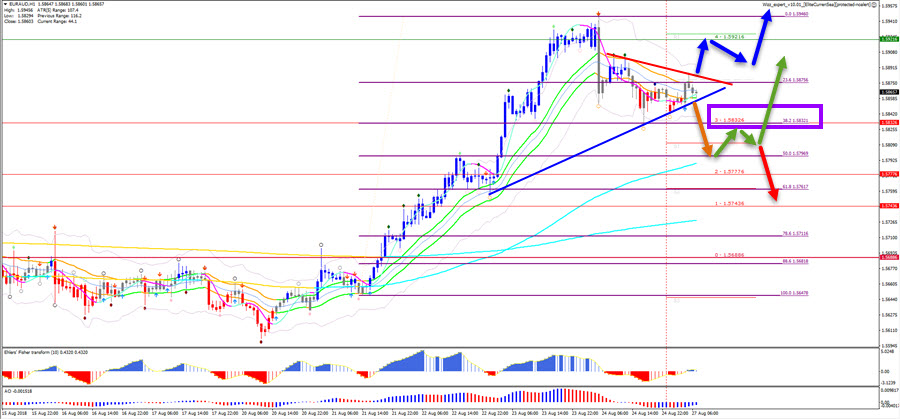
The EUR/AUD bounced at the 38.2% Fibonacci retracement level and wizz level 3 confluence. A bullish continuation is possible if price breaks above the trend line (red) and later on wizz level 4. A retracement to the 50% Fib is possible and a bouncing spot.
Good trading,
Chris Svorcik
Elite CurrenSea


Leave a Reply