🚀 Ethereum Close to Bullish Breakout Above 21 & 144 ema Resistance 🚀

Dear traders,
the Ethereum instrument (ETH/USD) is building a retracement similar to Bitcoin. The bearish pullback was deep but price action did respect the 61.8% Fibonacci retracement level.
Compared to our analysis last time, price action completed on more wave up before completing the wave 5s. This article analyses the Elliott Wave and chart patterns to understand what to expect next.
Price Charts and Technical Analysis
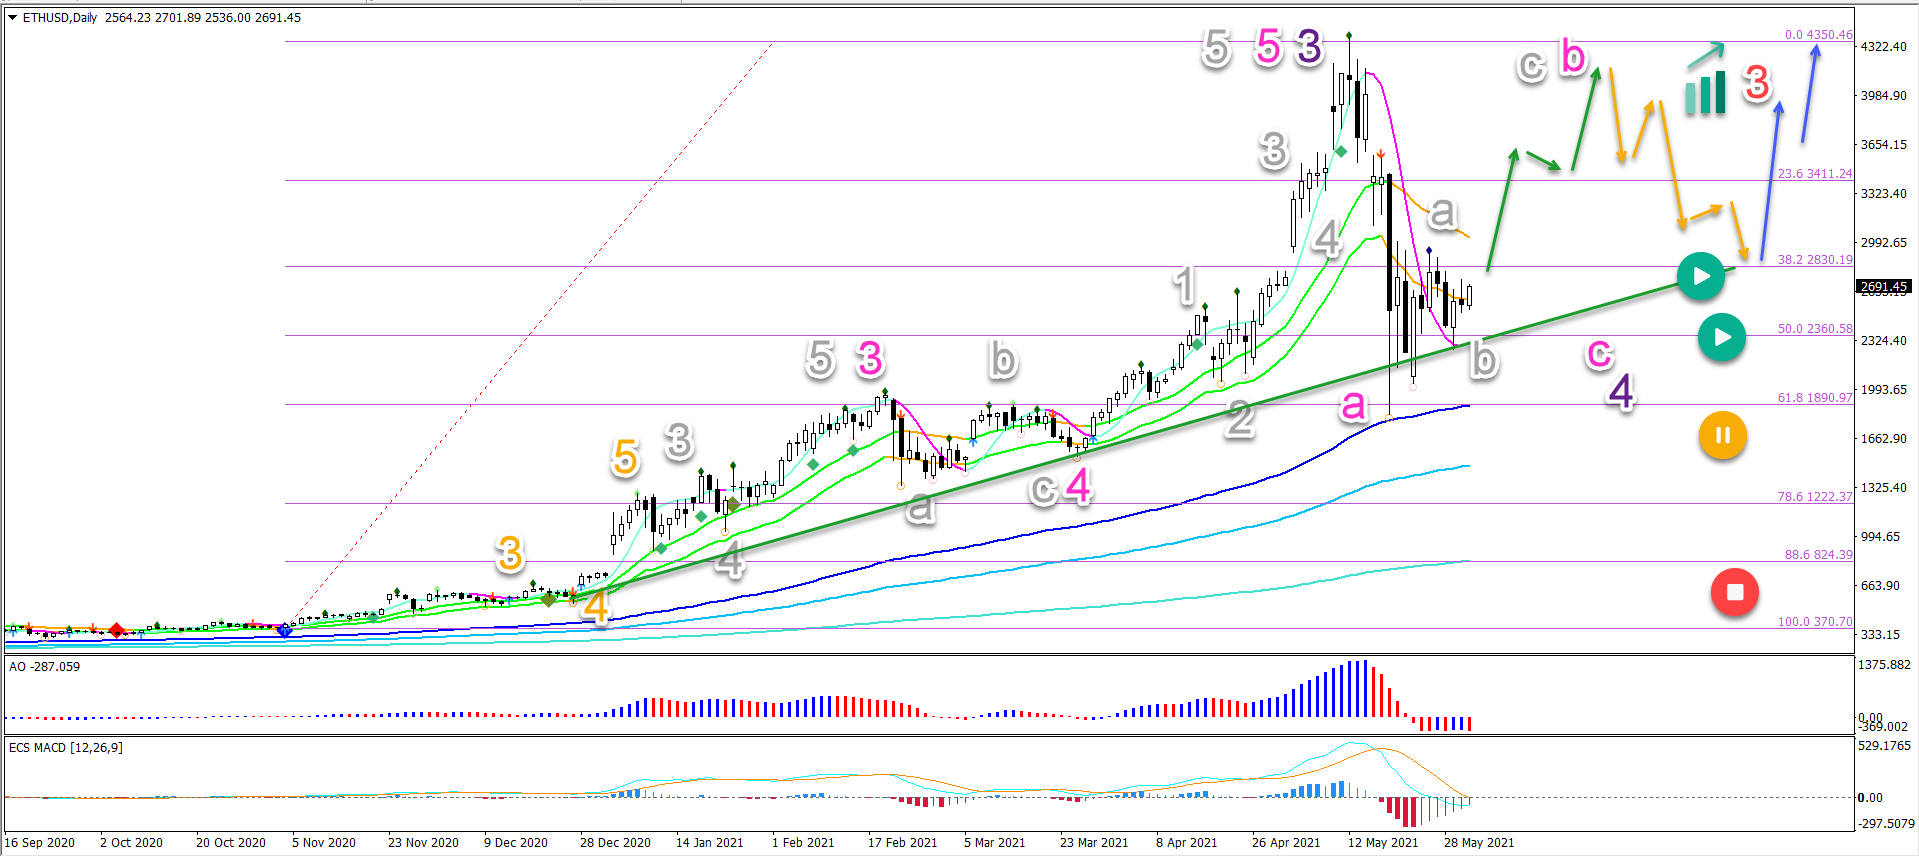
The ETH/USD seems to be building a bearish ABC (pink) pullback within wave 4 (purple). The correction could also expand into an ABCDE triangle chart pattern as well:
- The wave 4 (purple) analysis remains valid as long as price action stays above the 61.8% Fibonacci retracement level and 144 ema zone.
- A break below the 61.8% Fib level places the wave 4 on hold but not the entire uptrend necessarily.
- A bullish bounce has already occurred after 9 daily candlesticks failed to break below the low at the 144 ema and 61.8% Fib.
- A bullish breakout (green arrow) could indicate a retest of the previous high and top.
- A bearish bounce at the top confirms the wave B (pink) and start of wave C (pink).
- A bullish bounce at the support trend line (green) could confirm the end of wave 4 (purple) and the restart of the uptrend in wave 3 (red).
- The bullish targets are aiming at $5000, $5500, and $7000.
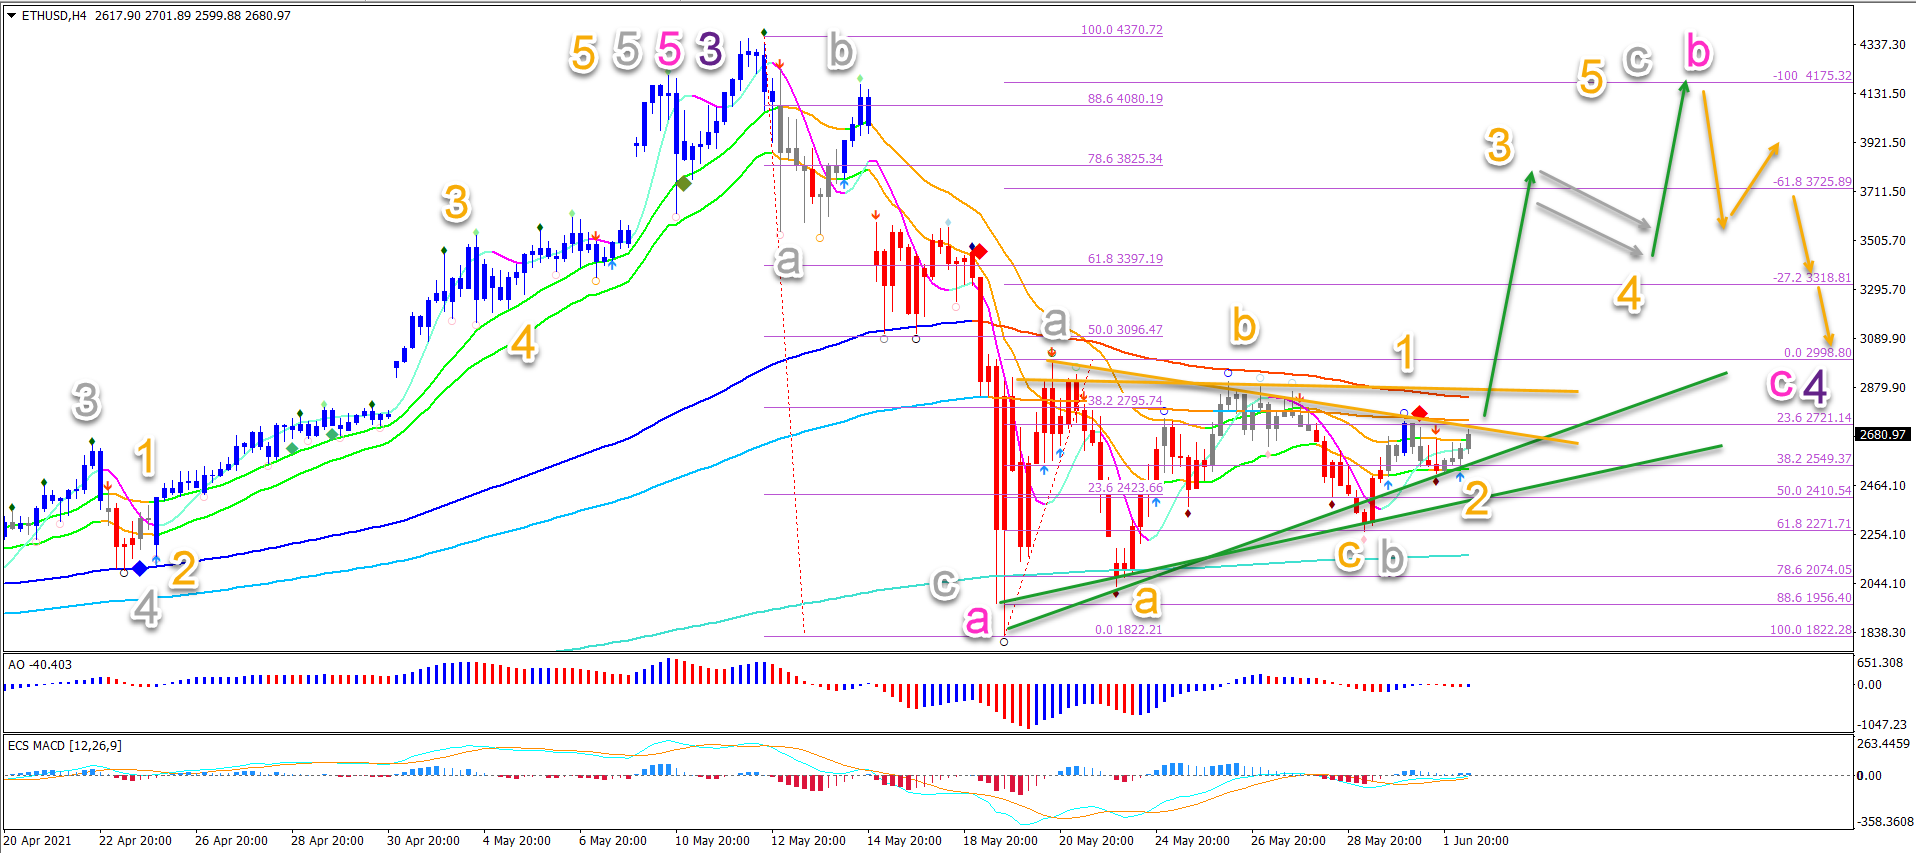
On the 4 hour chart, price action seems to be moving sideways. Price action is unable to break the bottoms or tops:
- The bullish bounce is probably a wave A (grey) as long as price action stays above the bottom and 100% support Fib.
- A bearish ABC (orange) seems to complete wave B (grey).
- A bullish 5 wave pattern (orange) could complete wave C (grey) in wave B (pink).
- Price action needs to break above the resistance trend lines (orange), 144 ema zone, and 21 ema zone for a bullish breakout.
The analysis has been done with the indicators and template from the SWAT method (simple wave analysis and trading). For more daily technical and wave analysis and updates, sign-up to our newsletter.
Good trading,
Chris Svorcik


Leave a Reply