? Dow Jones Index Completes Triangle and Awaits Bull Break ?
Subscribe
Hi traders,
The Dow Jones Index (DJI) is showing a triangle chart pattern which is indicated by the support (blue) and resistance (red) trend lines. Price is building this triangle pattern after bouncing at a shallow 38.2% Fibonacci support zone which is making a wave 4 (purple) pattern likely at the moment.
Dow Jones Index
Week
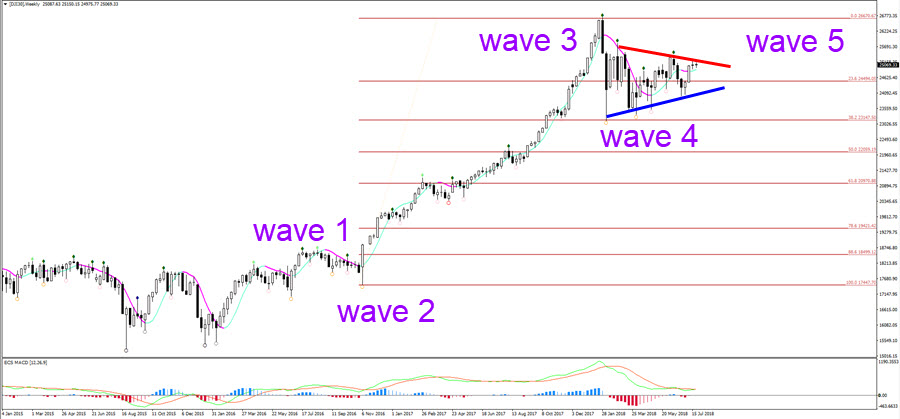
DJI needs to break above the resistance trend line to confirm the end of the wave 4 and the start of the wave 5. The bullish breakout and push could create a new higher high. This could be the last bull run as a bearish correction seems to be overdue and price is reaching or already has reached a potential bubble status. That said, uptrends can last long and one more push within wave 5 seems to make sense when reviewing wave patterns and the strong bullish momentum in wave 3.
Day
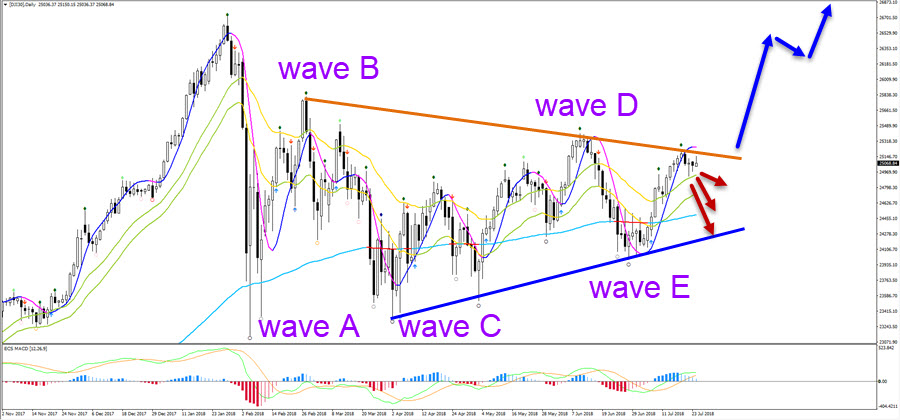
The daily chart is showing the triangle pattern from up close. It seems like an ABCDE pattern has been completed and price is now ready for a bullish breakout. A break above the orange trend line could confirm the end of the triangle pattern but before a breakout occurs, price might make a pullback to the bottom of the triangle or moving averages first.
Good trading,
Chris Svorcik
Elite CurrenSea


Leave a Reply