DAX30 ? Will 2018 Be the Year of the Big Short? ?
Subscribe
Dear Traders.
there is much talk about a big market crash that’s just around the corner, which could see stocks and indices fall like stones.
The DAX30 is among those candidates.
But can we see technical evidence in the charts for such a scenario? Are there signs of a pending reversal? Are there ways to trade it?
This article will explore all these questions and try to unveil what may be in stall for the DAX30 in 2018.
What has happened so far?
The monthly chart gives us a nice overview of the bullish trend which has been in place since 2003. The financial crash of 2008 is reflected in the sharp bearish move which is labelled as pink wave 2.
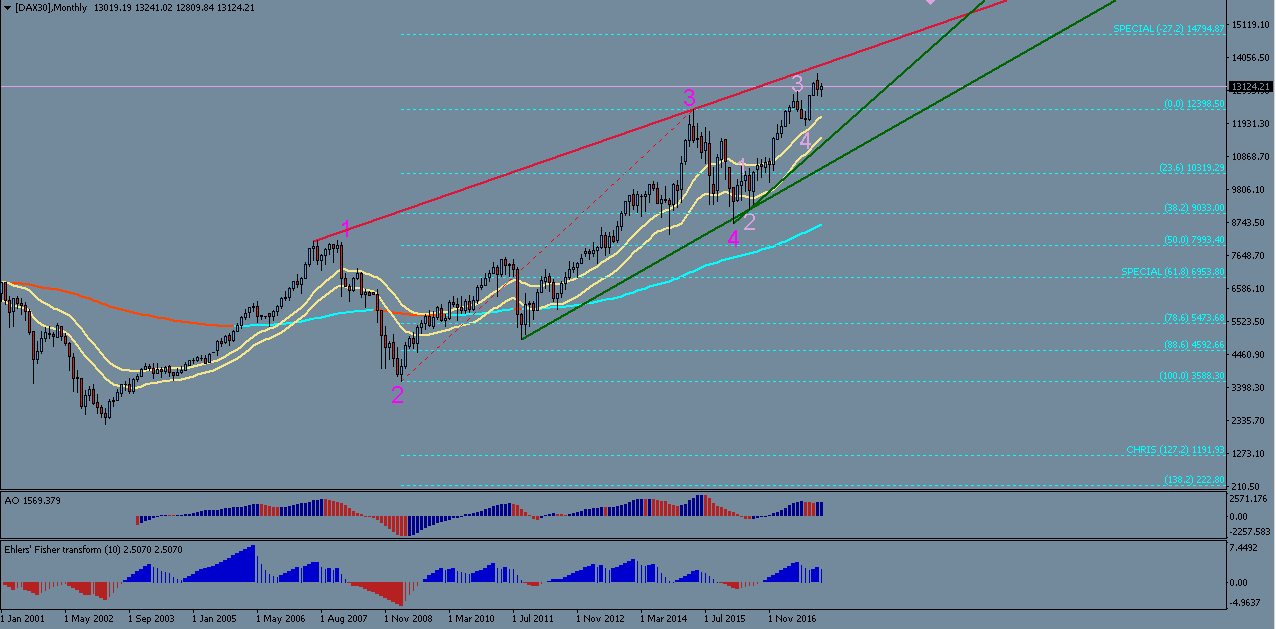
The rise since 2009 can be attributed to the dawn of Quantitative Easing (QE). QE meant that vast amounts of freshly created money became available to big banks, virtually for free. A large portion of this money went into the financial markets, which ushered in the the bull markets we have seen over the last decade.
The European Central Bank (ECB) introduced QE at the start of 2015 and it is of note that the strongest bullish momentum on the DAX was seen at that time, which formed part of the impulsive pink wave 3.
Technicals Indicate Uptrend Limitation
The above chart shows us a fairly clear impulsive Elliot Wave structure, which is now in its later stages, most likely in the final Wave 5. The AO indicator at the bottom of the chart shows that momentum peaked in 2015. Price then corrected during pink wave 4, and resumed its uptrend since February 2016. But the momentum since then has been unable to exceed the strength of momentum of the previous wave 3, in spite of the fact that it created higher highs. This suggests that divergence is starting to occur between price levels and momentum, which is an early warning sign of trend reversals.
This divergence is virtually confirmed when viewing the DAX on the weekly chart (below) in the form of continually lower momentum, while price is making higher highs. Divergence would be fully confirmed if the AO reading drops to the 0 level over the next few weeks, which seems likely.
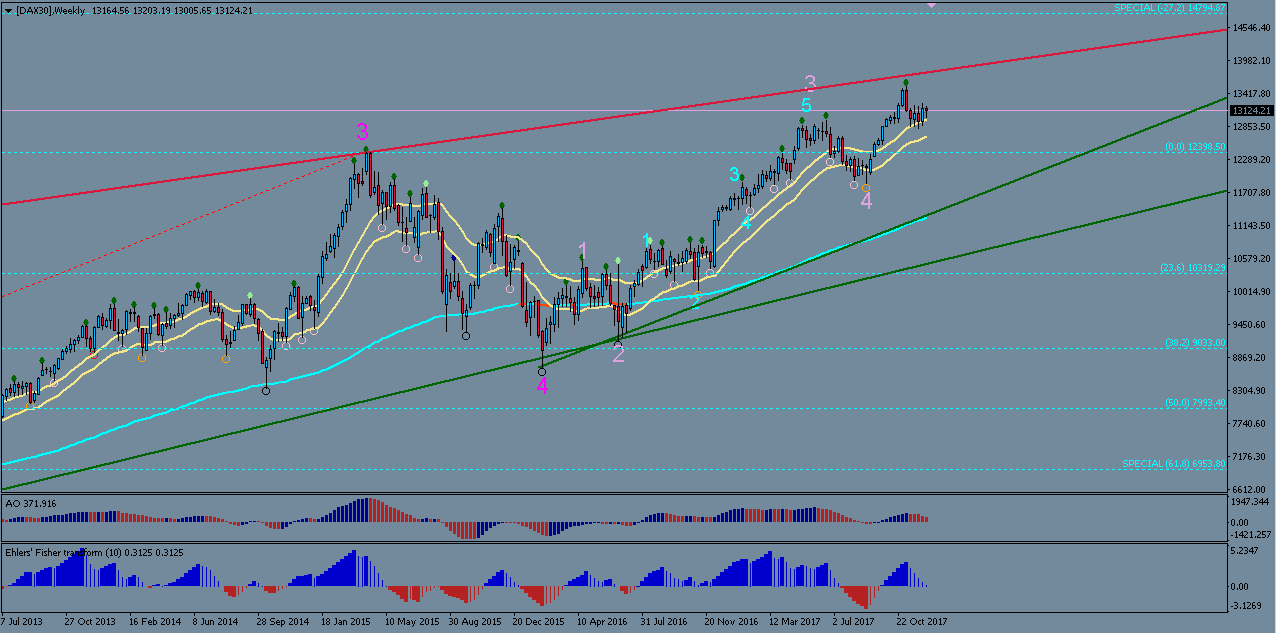
Elliot Wave Analysis also Hints at End of Trend
Aside from the momentum indicators, Elliot Wave analysis of the weekly chart also suggests strongly that the DAX trend is about to finish. The internal structure looks as though price is in Wave 5 (pale pink) of the larger Wave 5 (pink), i.e. virtually at a final culmination.
However it is important to remember that trends can extend and create 5 smaller sub-waves to push price higher yet.
Generally though, a Wave 5 tends to end at the -27.2% Fibonacci target of Wave 3. In the case of the long-term DAX wave count (pink), this target would be at around 15000, which is a confluence point with a powerful psychological round number, and could also coincide with a key resistance trend line (red). 13900 – 14000 is another important zone which i discussed in my previous DAX analysis (here).
So 14000 – 15000 will be a critical decision zone that could very likely herald the start of a large downward correction. From a technical perspective it is very plausible that we could see these record highs, as well as the ensuing bearish correction, occur during 2018.
How Low Can You Go?
As to how severe this bearish correction could be is difficult to tell. However it is not uncommon for large corrections to decline back to levels of a previous wave 4. In the case of the DAX, it would mean that a drop to the historic support of around 9000 is quite realistic, which would equate to more than a 30% depreciation.
Are There Ways to Trade the Bearish Move?
In principle yes, although there is speculation that the drop could happen so fast that it becomes impossible to trade it, due to the operation of AIs in the market.
But if this is somehow not going to be the case, we should see recognizable wave and chart patterns emerging that enable good short positions to be entered.
One such pattern would be if price starts to form a rising wedge between the green support and red resistance trend lines. This chart pattern is highly indicative of an imminent bearish correction especially if divergence is present at the same time.
From an Elliot wave perspective, any correction consists of at least 3 waves (ABC). Therefore if an initial drop occurs that breaks below the 21 EMA, in the form of Wave A, we can expect price to attempt another upwards move during wave B that could test the previous high again. Therefore the second bearish push, as Wave C, is usually the best to trade because we already have confirmation of a bearish move during Wave A, while the retracement of Wave B should enable good entry levels at higher prices for short positions. Using the 21 and 144 EMAs in combination with support and resistance levels are key to trading any reversal successfully. The start of wave C should see a second break below the 21 EMA which would be an ideal entry spot. Using the EMAs of the Daily time frame is probably best.
All in all, 2018 could turn out to be a very a dramatic year for the DAX30 and other indices. With some forethought and analysis, this could turn into a great trade opportunity.
All the best along your trading journey…
Hubert
Follow Hubert on Twitter


Leave a Reply