BTC/USD Uptrend ? Bounces at 50% Fib and $5500 ?
Subscribe
Dear Traders,
Bitcoin is in a massive bull run and has recently hit the $7770 mark versus the US Dollar (USD).
The uptrend might have seen totally unstopable but a few days ago price did make a substantial retracement back to +/- $5400.
Today’s analysis reviews the BTC/USD instrument and analyses whether more retracement is possible or whether price will continue higher immediately.
BTC/USD’s Sharp Bearish Retracement
There are multiple pros and cons of trading Bitcoin and other cryptos, but one thing seems sure: the massive uptrend on the BTC/USD does not encounter a deep retracement too often. There were a couple of exceptions during 2017 when price made a retracement back the 38.2% Fib or deeper. September and November are the two most recent examples. September’s decline saw price fall from $4950 to $3000 before a continuation of the uptrend recently took price up to a new peak at $7770.
Last week’s (Nov 9-12) bearish pullback was sharp and offered strong momentum but the BTC/USD uptrend seems untouchable at the moment. With no presence of any divergence signs, a continuation of the uptrend does indeed seem very likely. For the moment, the main questions are not whether the uptrend will continue but will price be able to retrace deeper and when will the uptrend continue?
When Will Bitcoin’s Uptrend Continue?
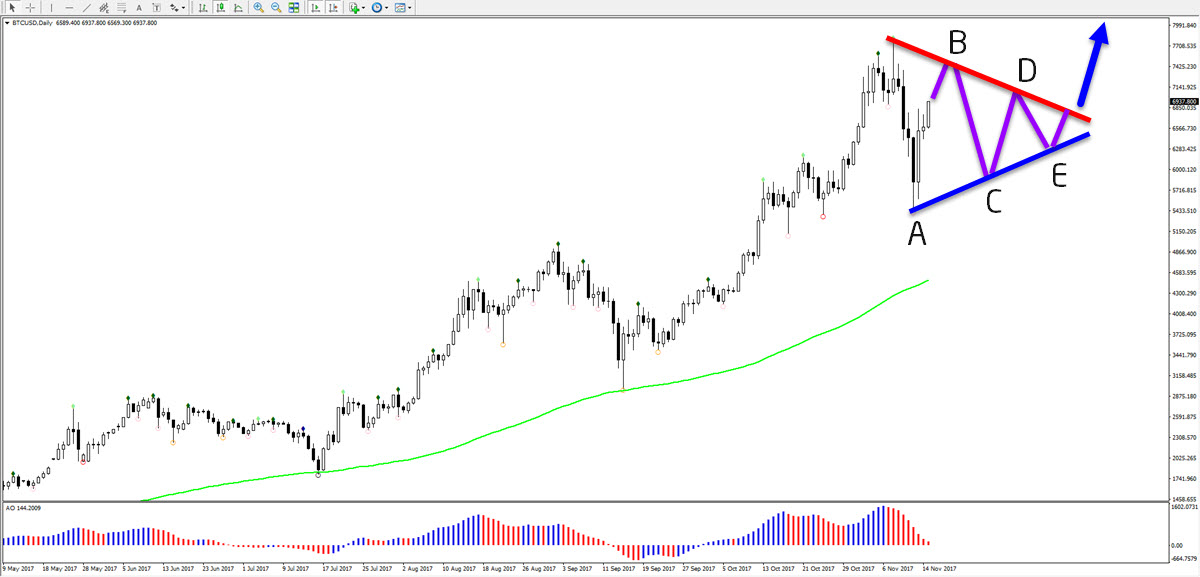
Although price could immediately break above the top and continue with the uptrend, there is a decent chance that price could build a corrective triangle if it respects the previous high. An ABCDE contractring triangle chart pattern is a typical continuation formation after price shows strong momentun. In such a pattern it also clear when the uptrend is expected to continue: once price completes the wave E (see first image).
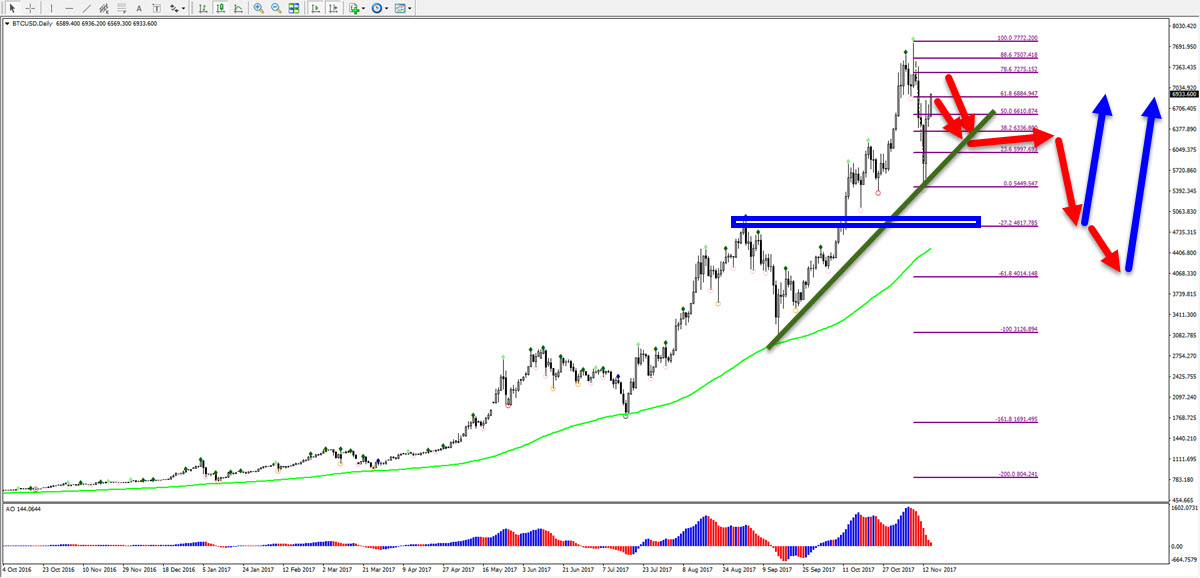
The 2nd alternative is a sharp bearish ABC zigzag. In that pattern price is now in a wave B correction and price will head lower for a wave C. The uptrend will continue once price hits the target of the wave C , which could be at around $5000 or max $4000.
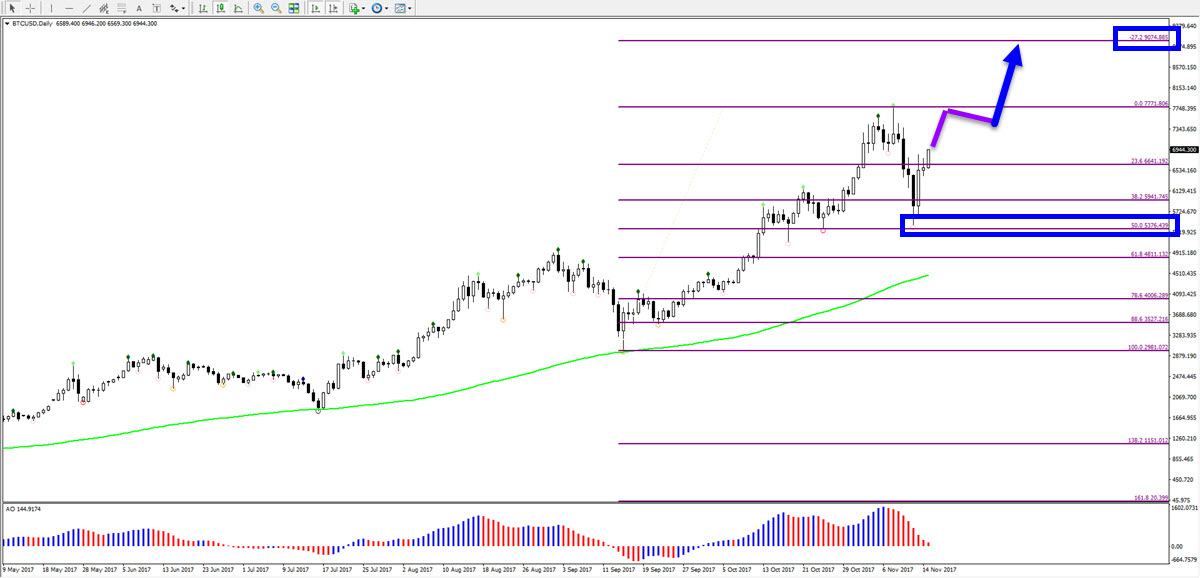
Last but not least, thie crypto currency does not have rertace at all. A break of the top and recent high at $7770 could indicate that the uptrend is moving higher without any expanded or deeper correction. In that case, the target could be the -27.2% at $9000 and perhaps the psychological round level of $10,000, which in turn could create a new bearish pullback.
Hope this helps and wish you good trading,
Chris Svorcik

.


Leave a Reply