? BTC/USD Resting at Long-term Resistance with Strong Bull Support ?


Dear traders,
Bitcoin (BTC) versus the US Dollar (USD) is building a consolidation zone before the long-term resistance trend lines. A bullish breakout could restart the long-term uptrend.
BTC/USD
Weekly chart
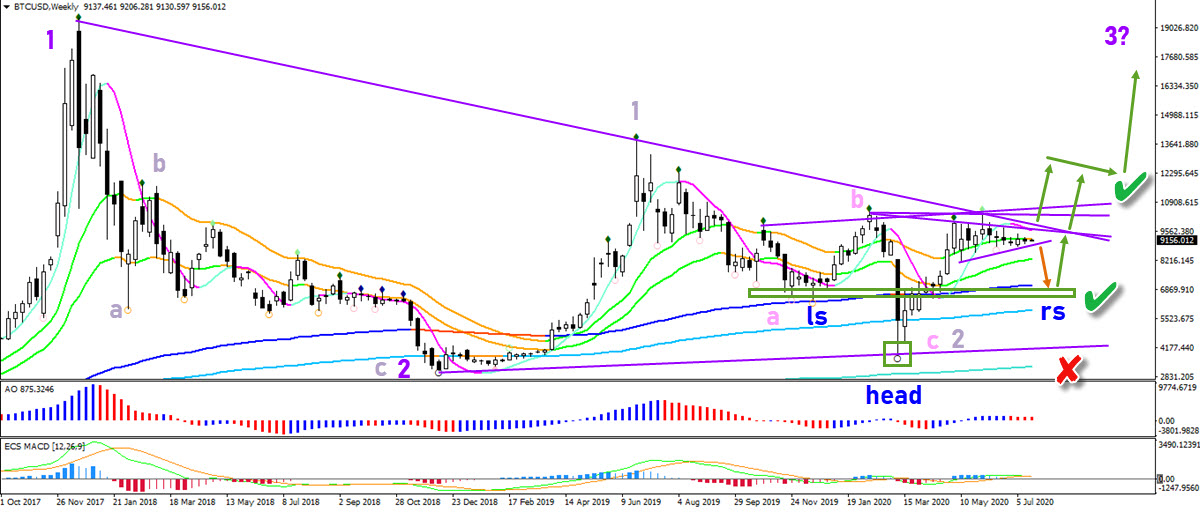
The BTC/USD breakout needs to be followed by a bull flag or triangle pattern to avoid any false breakouts. In that case, the nex push higher could retest the previous high and become a potential wave 3 (purple) if price can break the top. So far, two waves 1-2 seem to be completed.
A bearish bounce at the resistance could create an inverted head and shoulders reversal chart pattern. A bullish bounce is expected at support. Only a break below the previous would invalidate (red x) the bullish outlook.
The analysis has been done with SWAT method (simple wave analysis and trading).
For more daily technical and wave analysis and updates, sign-up up to our newsletter.
Good trading,
Chris Svorcik
Elite CurrenSea


Leave a Reply