? BTC/USD Breaking Weekly Resistance Trend Lines at 10,000 ?


Dear traders,
the Bitcoin (BTC/USD) is breaking above the weekly resistance trend lines (dotted purple). This could indicate a potential long-term uptrend. What is needed to confirm the breakout?
BTC/USD
Price Charts and Technical Analysis
A strong bullish weekly candle would certainly help. For instance, a bullish close near the high could signal that the bulls remain in control at the close of the week. A weekly candle should also have decent volatility and size. So far, the candle is medium sized. Another confirmation could be 2 bullish weekly candles in a row. A massive sell of and wick on the weekly candle could otherwise indicate a false breakout.
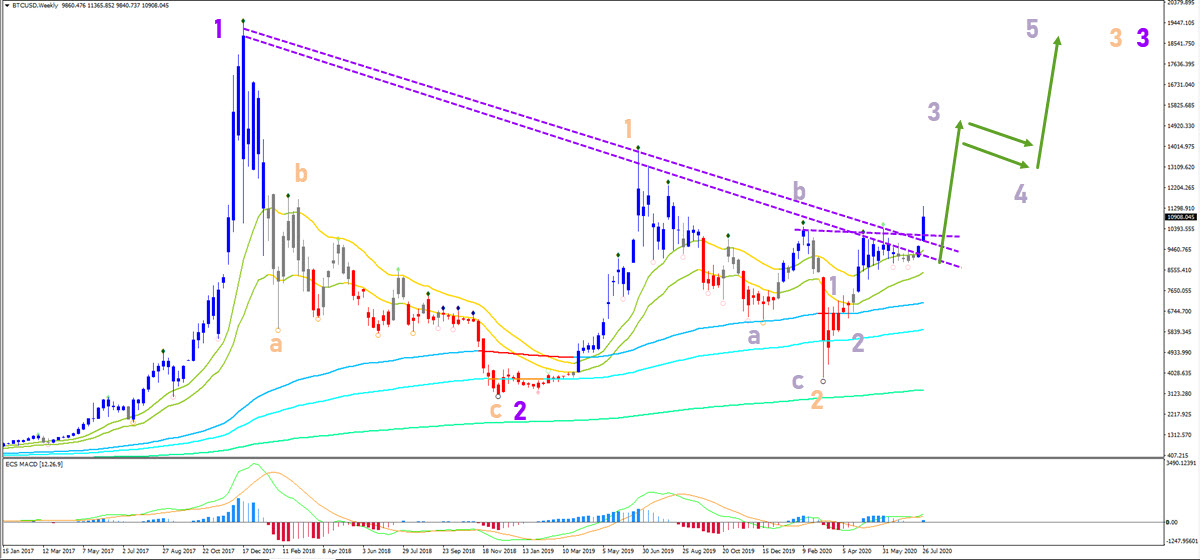
Currently, the uptrend is in full alignment. Price is above the 21 ema zone, which is above long-term MAs (144-233-610). A bullish breakout and continuation is expected at the moment. This could create a wave 3 (light purple) after price completed waves 1-2.

On the 4 hour chart, price needs to develop a bull flag to confirm the bullish outlook. Price remains in clear bullish territory if price action remains above the 50% Fib. A break below the 38.2-50% indicates a deeper retracement. A break below the bottom could indicate a massive false breakout and a return to a consolidation mode.
The analysis has been done with SWAT method (simple wave analysis and trading).
For more daily technical and wave analysis and updates, sign-up up to our newsletter.
Good trading,
Chris Svorcik
Elite CurrenSea


Leave a Reply