AUD/NZD – Uptrend Continuation?
Subscribe
Dear Trader,
The AUD/NZD has created interesting price action that shows options for new intra-month long positions.
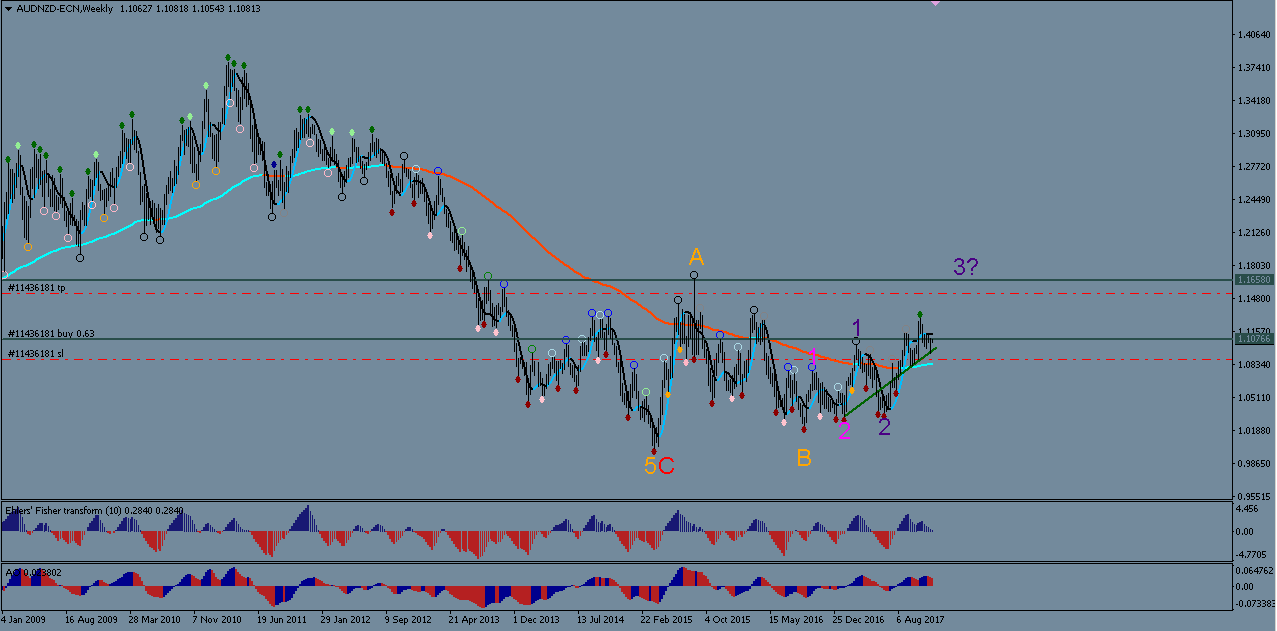
The weekly chart shows a fairly clear wave structure that indicates price found a long-term bottom at Orange Wave 5 and is now in an uptrend, possibly within a large ABC correction (Orange ABC).
Bullish Bounce Trade Option
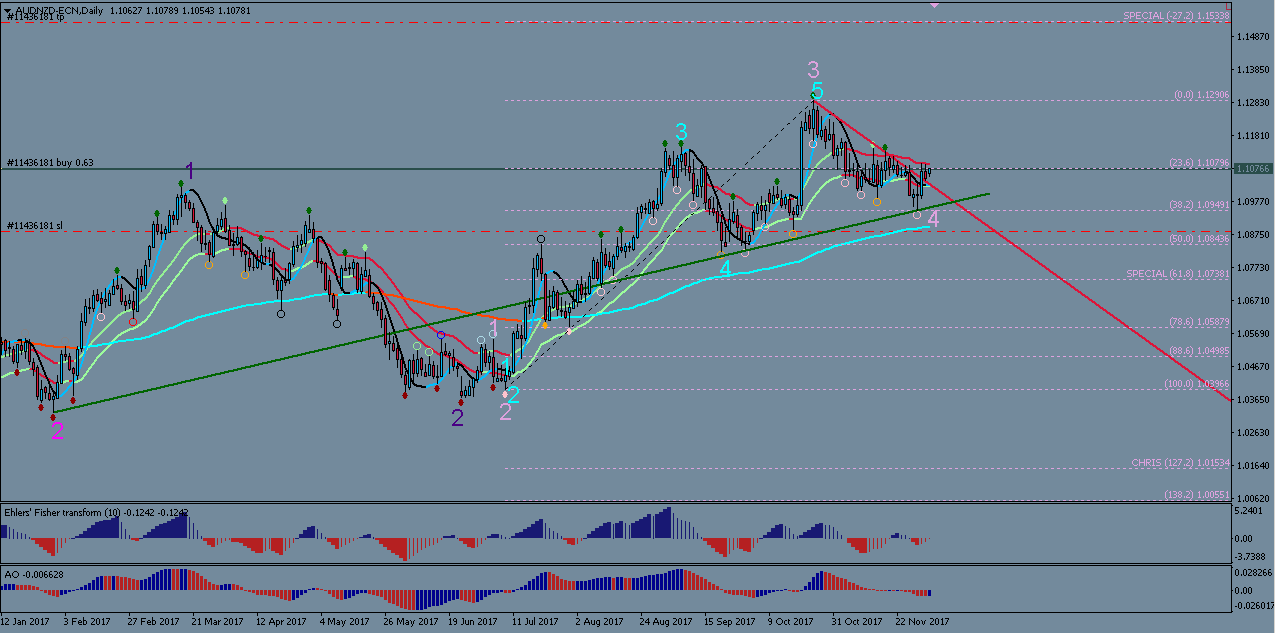
The Daily chart reveals details of the recent uptrend; showing an extended Wave 3. The smallest extension (turquoise waves) has probably completed at the last high of 1.1290. Price has been in a correction since then, but it strongly bounced at the 38.2% fib level last week and broke the resistance line (red) of Wave 4 (pale pink). This could indicate the end of Wave 4 and the continuation of the uptrend. Long entries could be taken at this level, targeting 1.15 to 1.1590 (-27.2% Fib of pale pink Wave 3). There is still divergence present on the Daily timeframe, and price did not touch the 144 EMA yet, so placing stop losses below the 144 EMA could be prudent.
It is difficult to tell whether price is going to retrace down again from the level shown in the below 4hour chart. Stop losses should therefore be set generously.

Potential for Adding More Positions Later…
This currency pair could provide opportunities for adding more long positions, but only if and when price establishes itself firmly above the moving averages and shows good momentum. In that case, waiting for small retracements on the 1 hour chart could provide new entry opportunities.
Trade well and safely…. fellow traders
Hubert
Hubert is a trader who uses wave patterns and the ecs.SWAT method. He is also doing analysis and articles for the EliteCurrenSea.com website.
.


Leave a Reply