🔥 AUD/USD Price Swings and Wave Before US Election 🔥

Dear traders,
the AUD/USD is building a choppy and corrective pattern. This is typical for a wave 4 (pink) and an uptrend continuation is around the corner.
This article explains when the bulls are expected to regain control – with just just a week before the US Presidential elections.
Price Charts and Technical Analysis
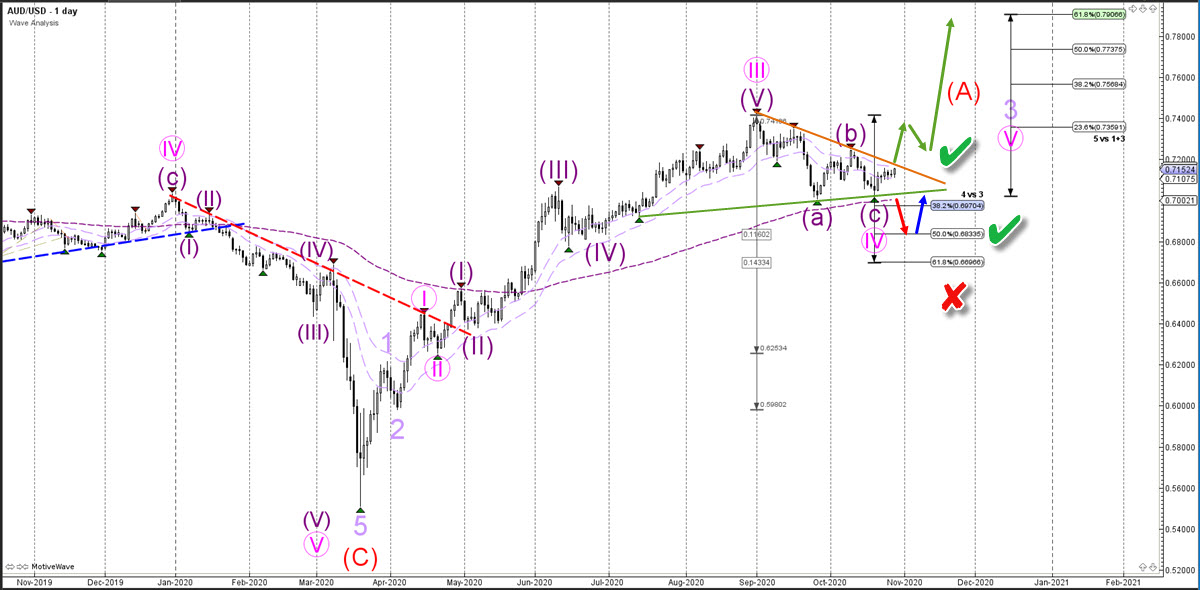
The AUD/USD needs to break above the resistance trend line (orange) for a bullish breakout (green arrows). The main targets are the Fibonacci levels of wave 5 vs 1+3.
There is plenty of space if the current Elliott Wave analysis is correct. Because price action can complete a wave 5 (pink) of wave 3 (purple) before completing another wave 5 (purple).
A bearish breakout could indicate a decline (red arrow) towards the 50% Fibonacci retracement level of wave 4 vs 3. This could still be a bullish bouncing spot (blue arrow). Only a break below the 61.8% Fib makes the wave 4 (pink) less likely.
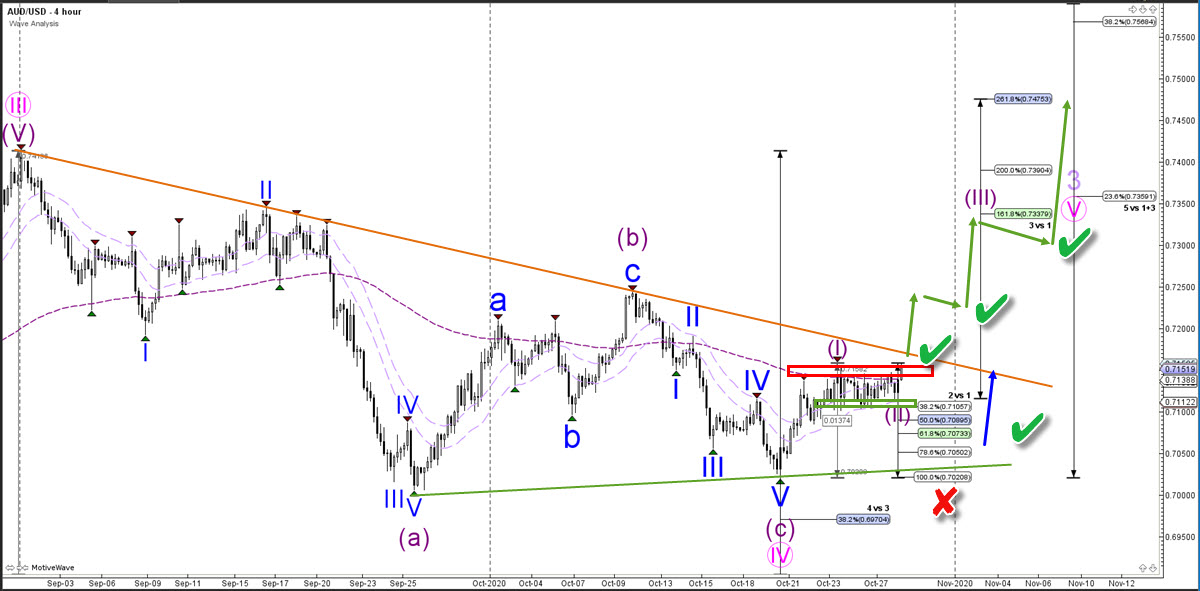
On the 4 hour chart, price action seems to have completed an ABC (purple) zigzag. Now price action could be developing a bullish wave 1-2 (purple) pattern.A break below the 100% Fib of wave 2 vs 1 invalidates (red x) this wave outlook. But a bullish bounce or breakout confirms the continuation within wave 3 (purple). Price will need to reach at least the 161.8% Fib before the wave 3 is fully confirmed.
The analysis has been done with the indicators and template from the SWAT method (simple wave analysis and trading). For more daily technical and wave analysis and updates, sign-up to our newsletter.
Good trading,
Chris Svorcik


Leave a Reply