How to Spot a Bottom in Crypto Market Using a “Wyckoff’s Method”

Before crypto was a thing, investor Richard Wyckoff came up with a theory about what drives market prices. He said that big-money investors repeatedly fleece smaller retail investors by moving the market for their own benefit.
This century-old theory describes crypto to a tee. See, it’s the large players who move crypto, and you can use the Wyckoff method to understand where they plan to take prices next.
What’s the Wyckoff Method?
Wyckoff’s theory is based on the idea of an unseen entity that controls the market. If you can figure out its game, you’ll be rewarded. If you don’t, you’ll be cleaned out.
The market moves in four stages. The first stage is accumulation,
Whales cannot simply purchase everything they want at one time, as there would not be enough sellers to provide them with the desired amount.
Instead, they must buy gradually, in smaller increments, keeping the price low until they have enough for their next purchase.
Once big money has bought up all the supply and the markup stage starts, there aren’t many sellers left, only buyers. As a result, prices move up quickly, enticing smaller investors (even those who just sold their positions to the whales) to buy back in and drive the price higher still.
Once the big money has profited from the markup, they’ve then got to realize those profits by selling out. And so begins the distribution phase, where they sell out bit by bit, and quietly, to keep the price at higher levels until they’re done unloading.
Keep in mind that big investors can also build up short positions here before they knock the price lower in the markdown phase.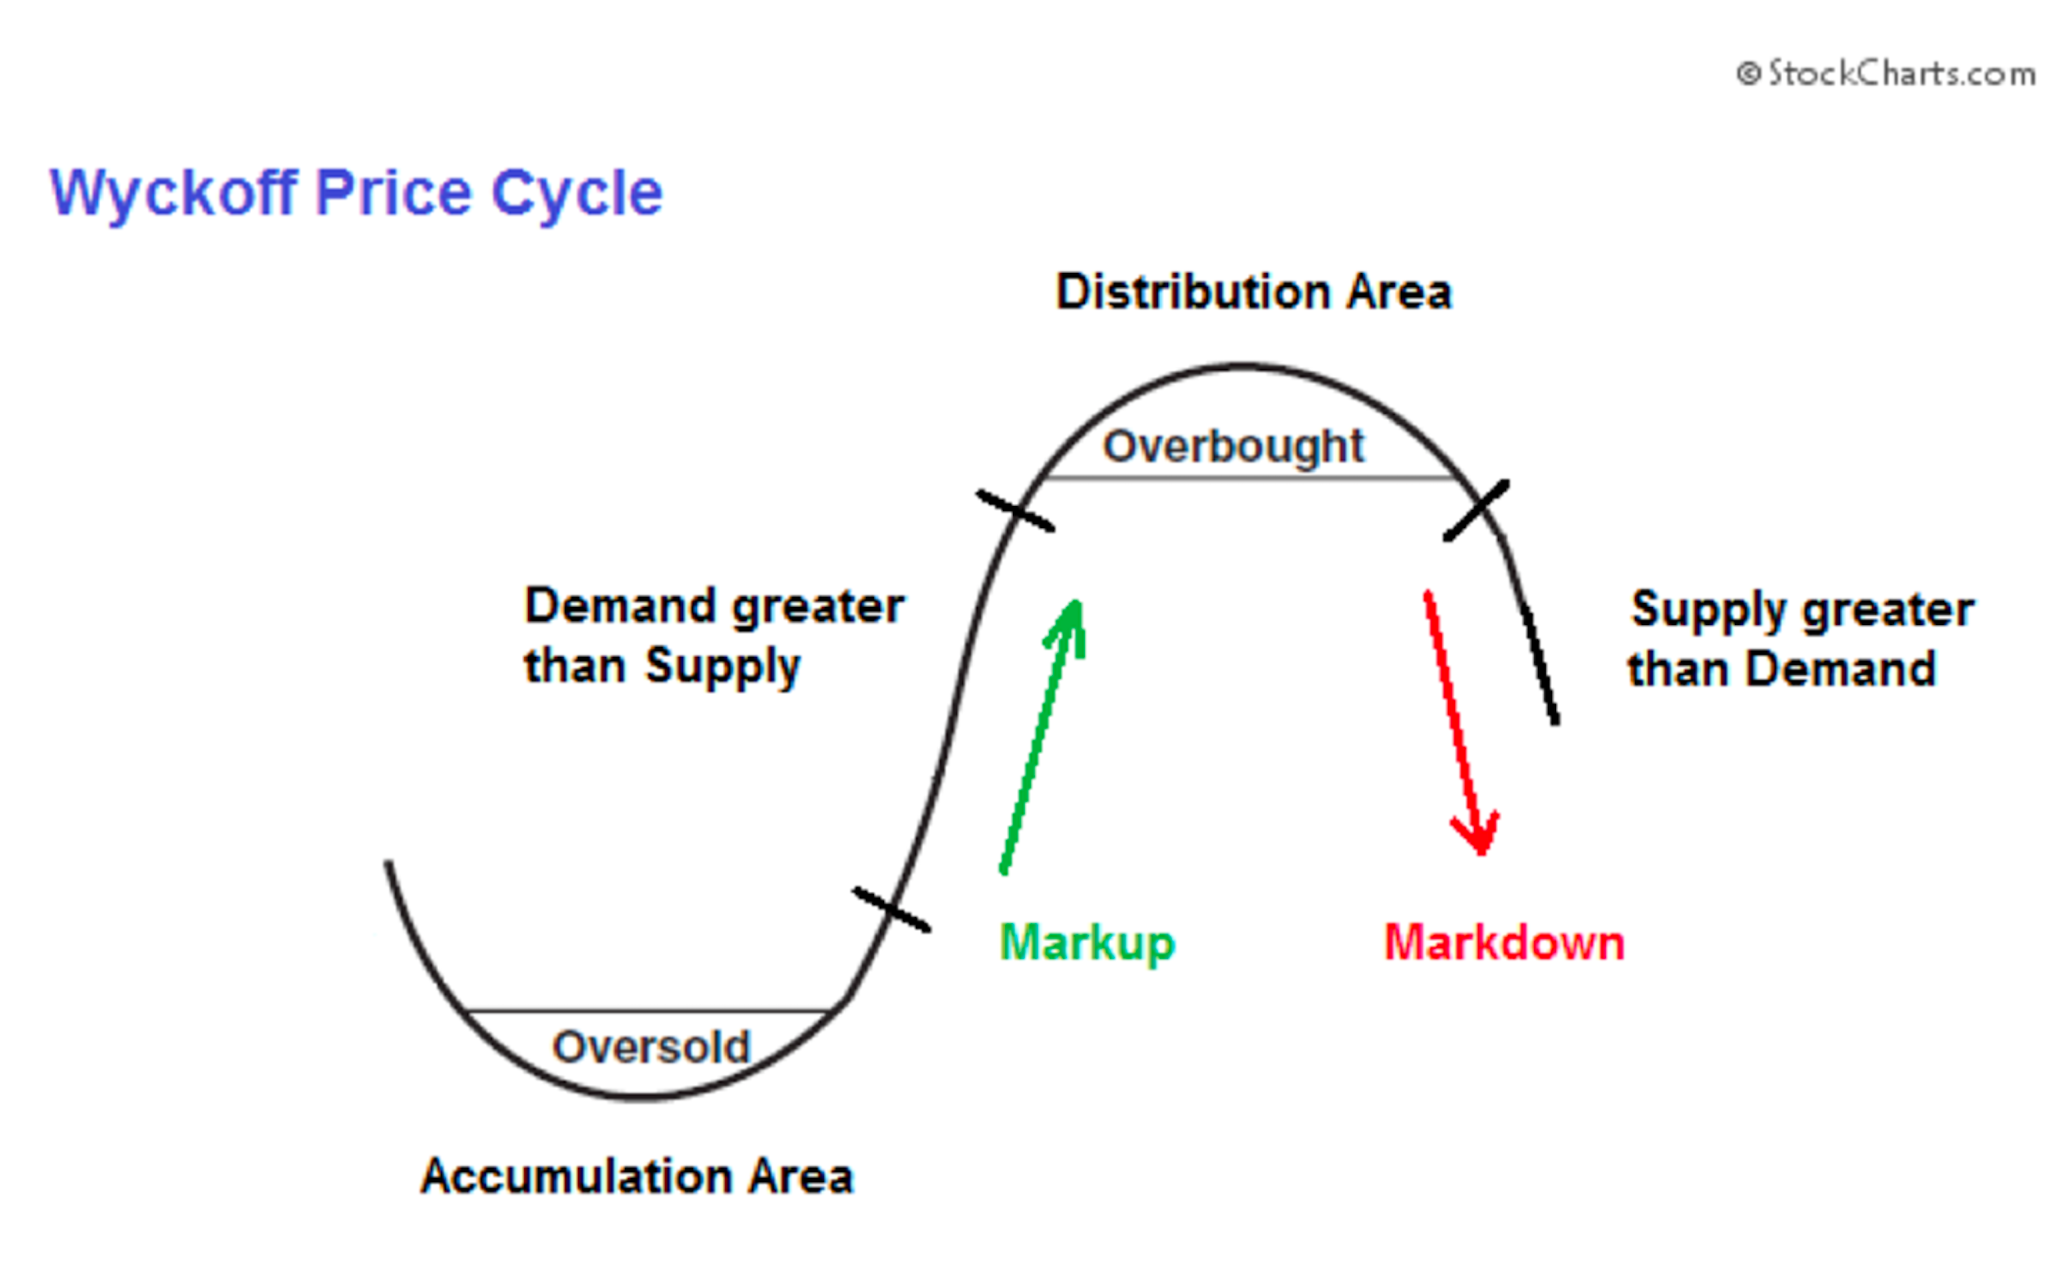
How to use Wyckoff Method to Understand Reversals in Crypto Market?
The crypto markets are constantly in flux, with bitcoin and other digital assets experiencing regular price swings. After all, crypto is a tiny market compared to the stock market, and it can take months for the big money to accumulate or distribute their positions.
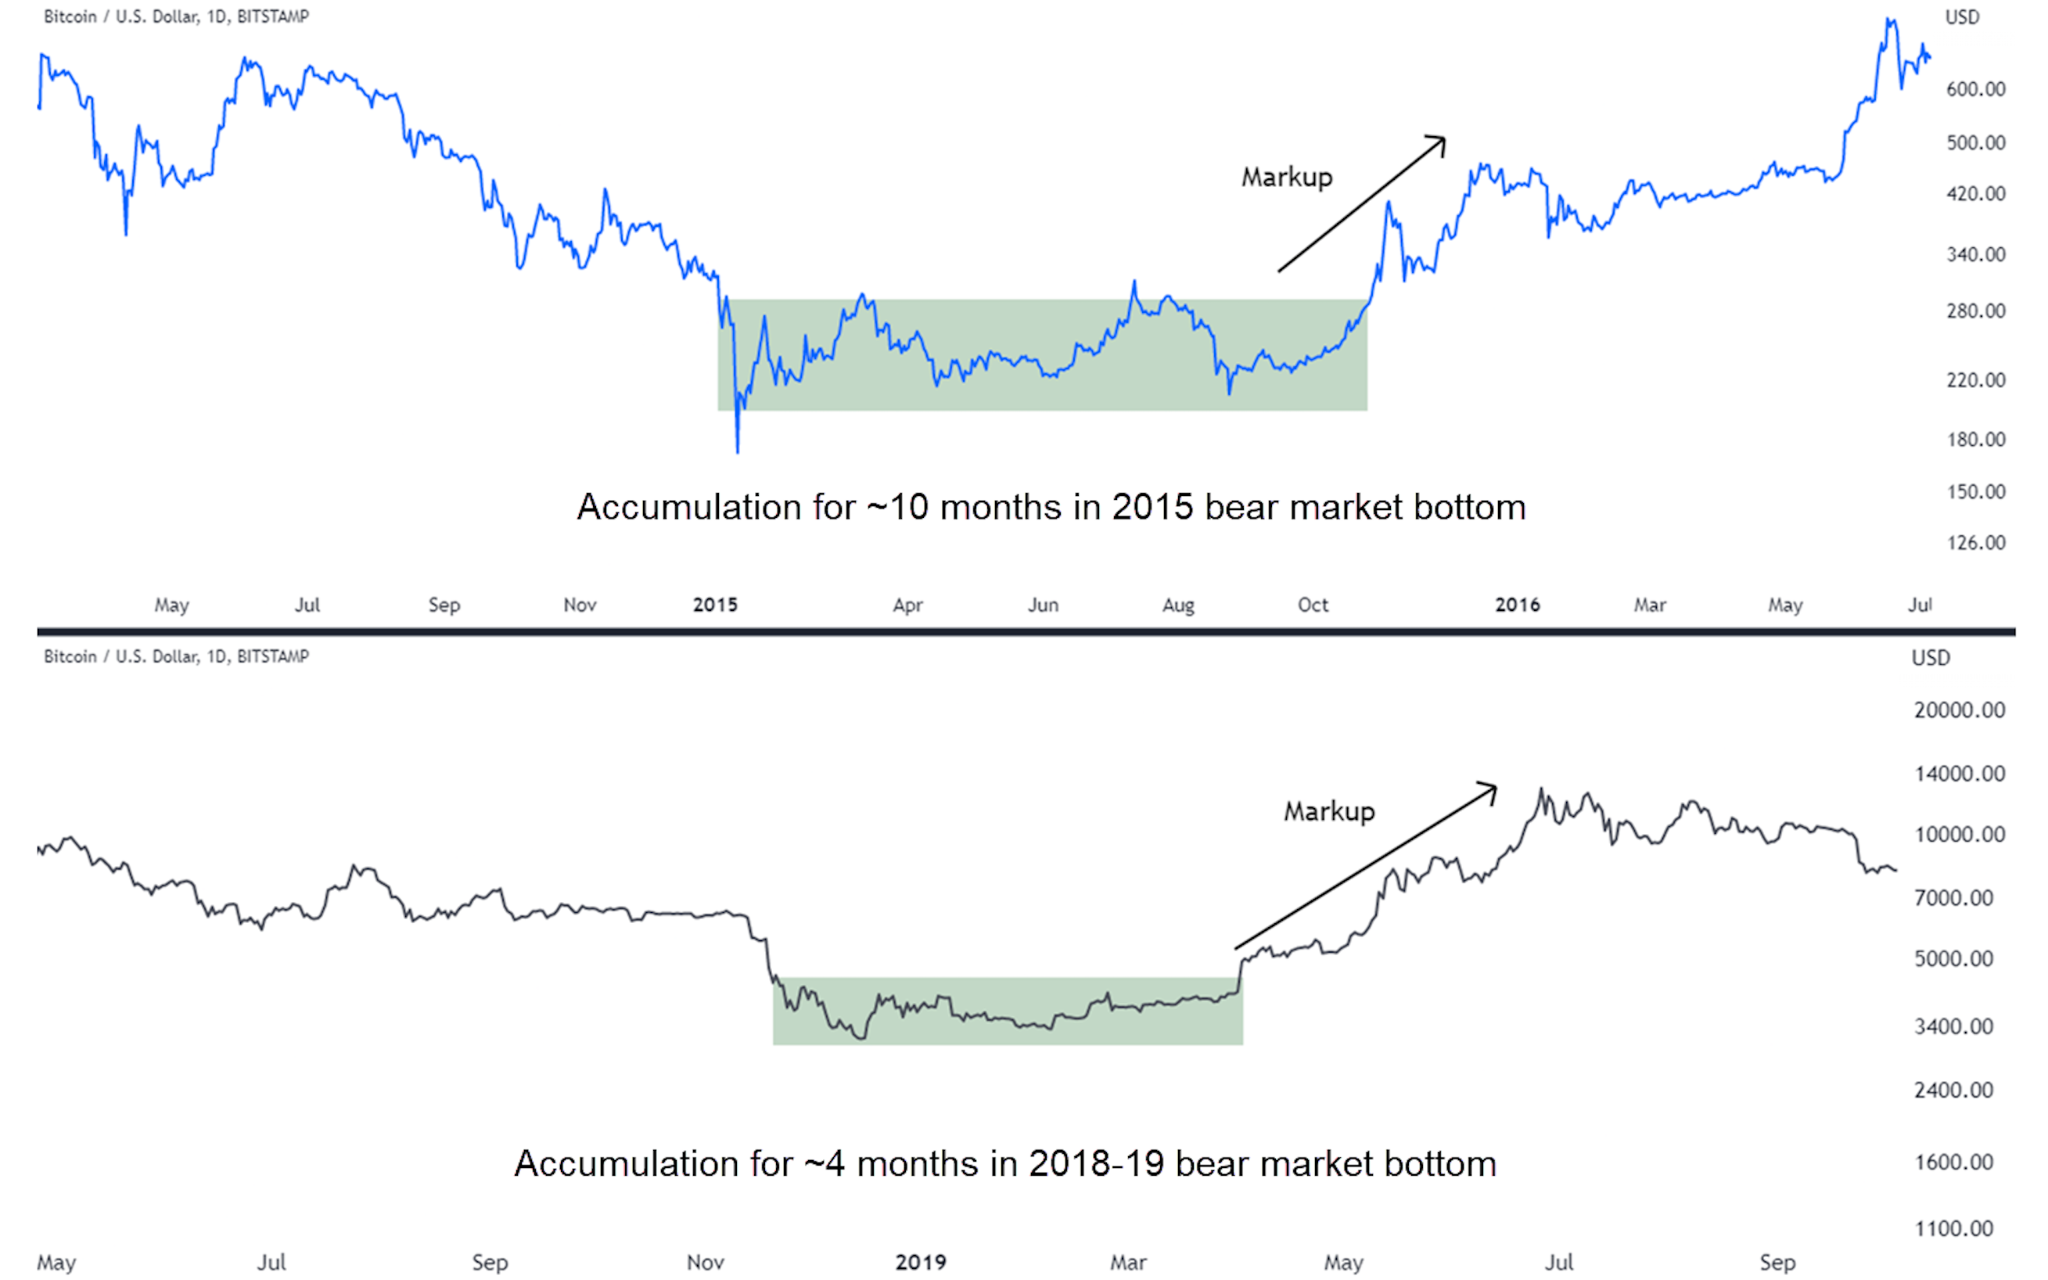
Why do you often see bitcoin bottoms take so long to form, with “V-shaped” recoveries being rare compared to stocks? In 2018 (gray line), bitcoin took four months to find a bear market low.
And in 2015 (blue line), it took ten months for bigger investors to get their buy orders in before the next bull run. It took 10 months for larger investors to get their buy orders in before the next bull run in 2015.
If you take a closer look at Bitcoin’s performance over the past two years, you can see several examples of Wyckoff stages in action.
Keep in mind that in reality, you can have two or more accumulations and markups in a row, or two or more distributions and markdowns in a row – as the chart below shows.

So how to tell if the price is going up or down exactly?
When digital assets like bitcoin are stuck in a sideways price range, it’s time to pay attention. Big players are likely building their positions during these periods of low volatility, so the next move could be a big one.
Indeed, that’s exactly what bitcoin has been doing since June, ranging from around $18,000 to just under $25,000.
There’s no sure way to tell if the current range is one of accumulation or distribution. However, there are technical clues that can help you make the distinction.
If it’s accumulation, you’ll want to take note of how the price behaves at the bottom of the range.
If it keeps getting bought up each time it dips slightly below, that’s usually a sign that big investors are buying in. When the price temporarily dips below the bottom of the range, many traders often take that as a sign to sell.
Since the big money needs a lot of sellers to buy in, they use those temporary dips to load up on more coins. By buying up coins during temporary dips, they ensure that they have enough sellers to meet their needs.
If the price of bitcoin were to suddenly drop below its current range and then get bought back up quickly over the next few days, that could be a good sign that the big money is accumulating.
That’s what Wyckoff called a “spring”, and you’d want to gradually start buying, according to the method.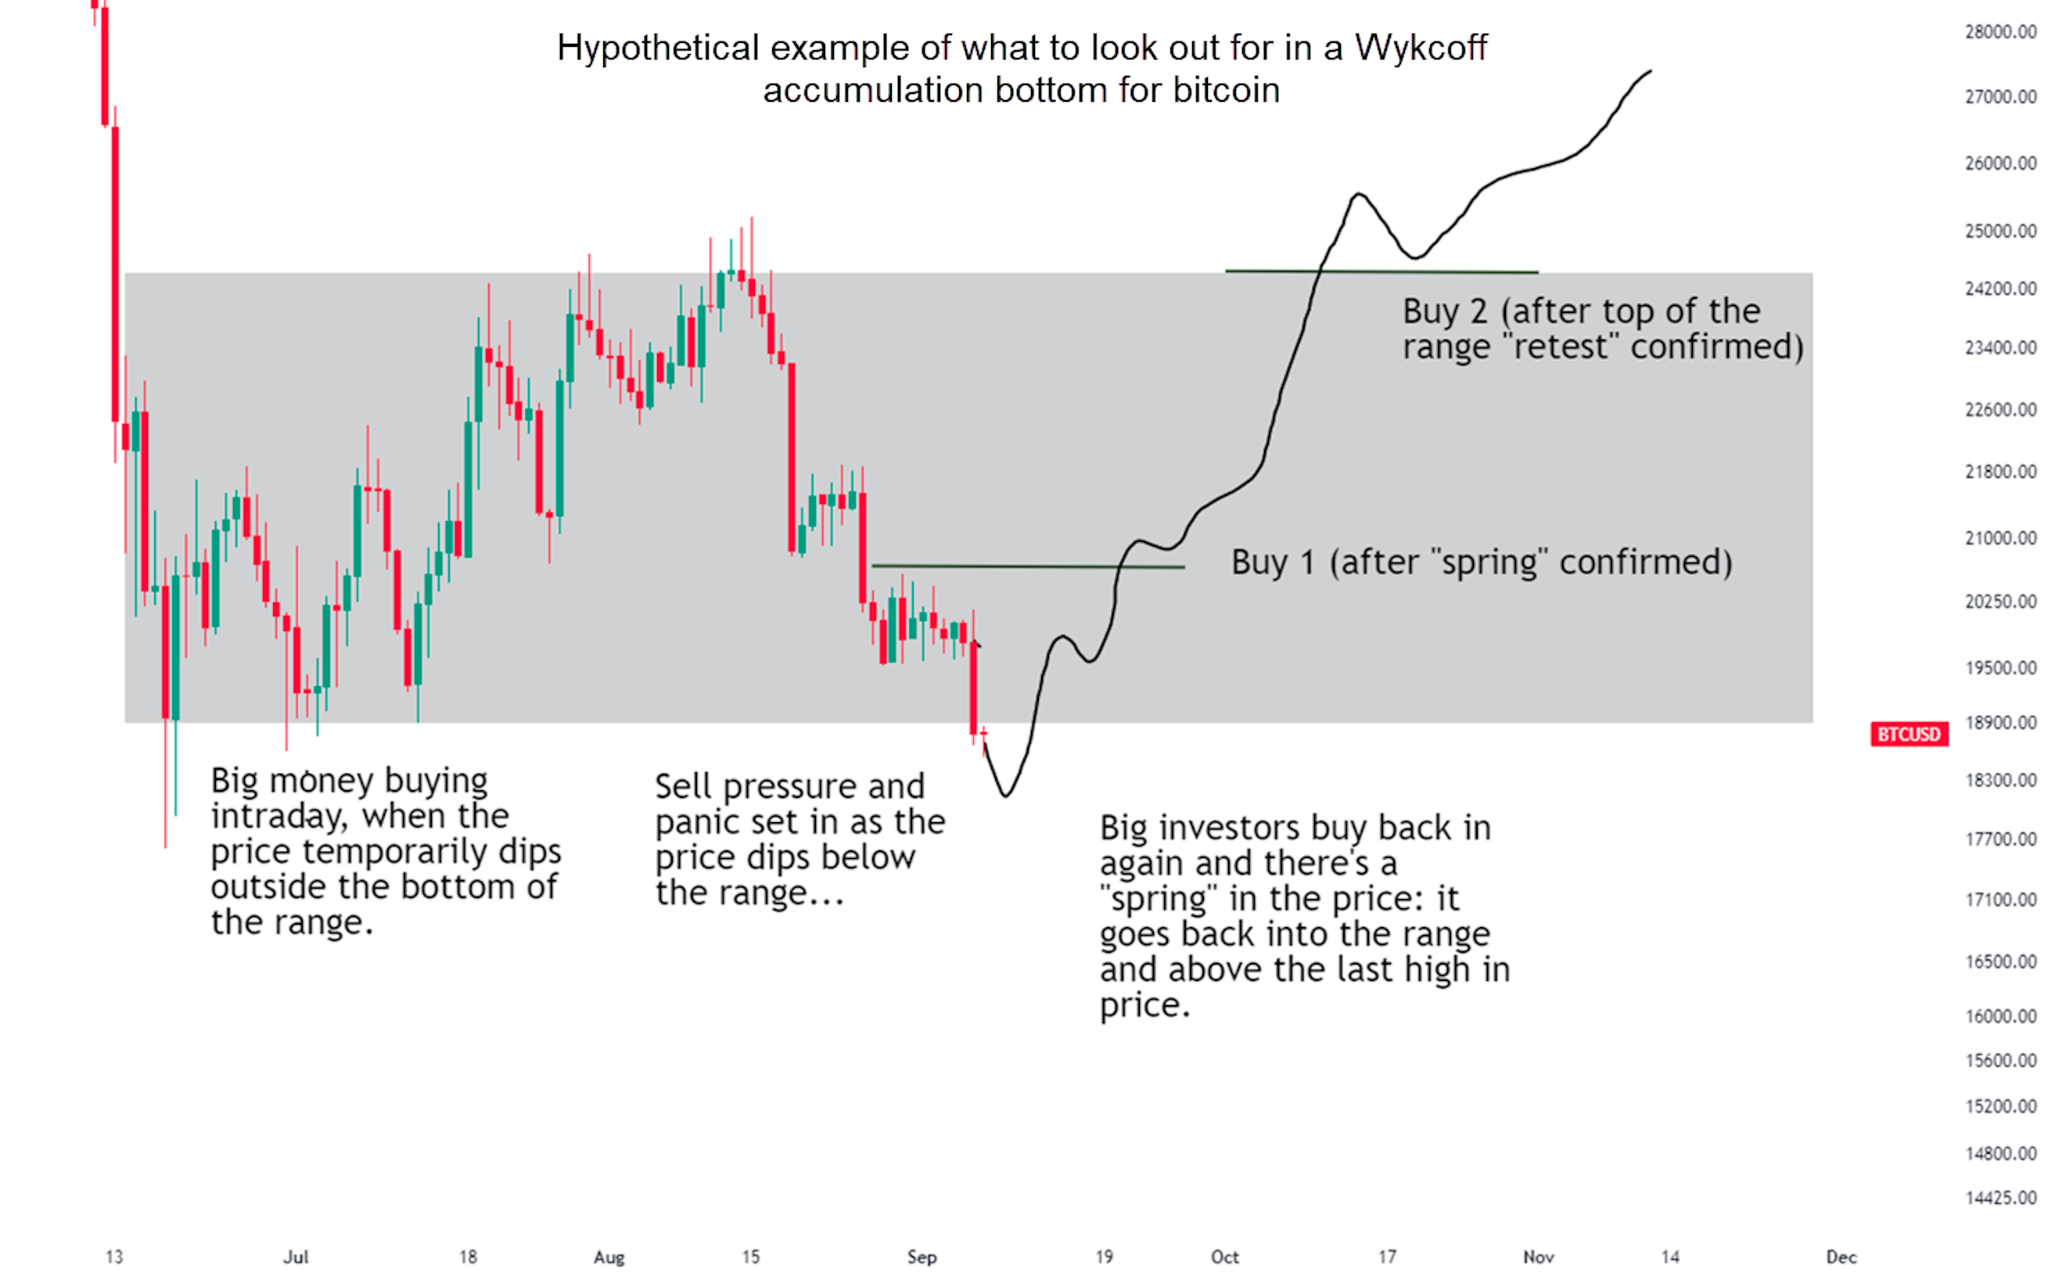
Another indication that big money has stopped accumulating and is now distributing would be for bitcoin to get above the top of the range and hold that level for a while. This would show that they have no more intention of selling.
The markets have always had patterns that can be analyzed and relied upon- no matter what year it is. This is because human nature does not change, and emotions such as fear and greed continue to drive market behavior.
This is why Wyckoff’s method, which is now over a hundred years old, can still be useful in today’s market.
Stay tuned to our newsletters and asset management solutions for an extra exposure to this exciting market and, as always, trade safe.
Team of Elite CurrenSea


Leave a Reply