? ETH/USD Bear Flag Break Aims at $200 in Final Wave-5 ?
Subscribe
Hi traders,
ETH/USD broke below the support trend line (dotted green) of the sideways bear flag chart pattern, which seems to be a typical shallow wave 4. The bearish breakout could complete a wave 5 of 5 of C at the -61.8% Fibonacci target (when placing the Fib on wave 3) at the $200 mark.
ETH/USD
Day

Of course, bullish price action candle stick patterns will need to confirm the bounce at the Fib target. Strong reversal signals could indicate the end of wave C of a long-term wave 2 and start a long-term uptrend and potential bullish wave 3.
4 hour
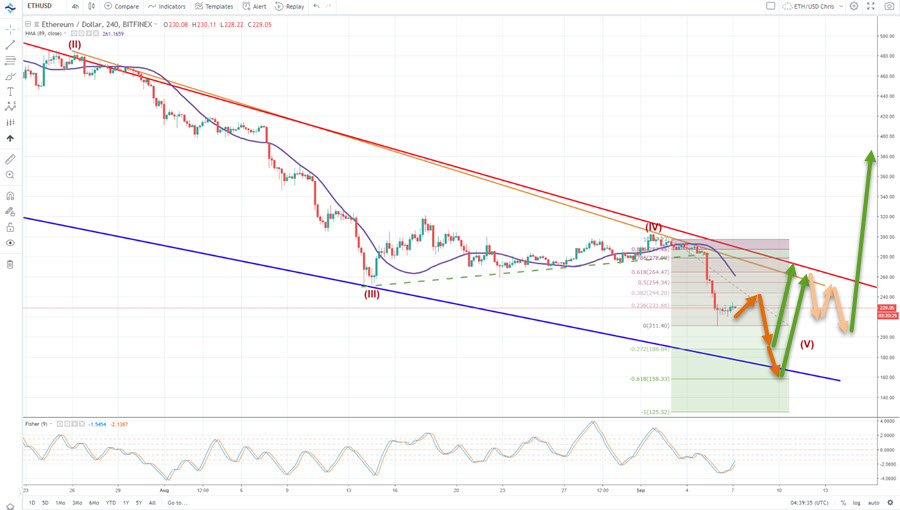
As can be seen on our Trading View profile, price would however need to break above resistance trend line and HMA 89 with strong and impulsive candles, then make a pullback that does not break below the bottom, and finally show a bullish continuation.
Good trading,
Chris Svorcik
Elite CurrenSea


Leave a Reply