? Can Wave Theory Help With Bitcoin and Crypto Analysis? ?
Subscribe

Hello Crypto Traders and Fans,
As a trader/analyst you are probably wondering whether Bitcoin will hit the $20k (20,000), $100k or even a million.
However, you don’t have to keep scratching your head too much if you learn how to use technical analysis techniques in determining the entry and exit points when trading cryptocurrencies.
In this article, we shall look at how to apply/use the Elliott Wave Theory analysis in interpreting the trends/waves formed during the price movements.
Do Cryptos Make Waves?
The quick answer is simply YES.
The prices of almost all financial instruments normally move up and down continuously on the trading charts, which includes the crypto currencies such as the BTC/USD (Bitcoin vs. US Dollars). Analysts and traders can therefore use the same tools used to analyse other financial instruments like currency pairs to analyse cryptos too.
This is actually an exciting opportunity for both traders and crypto fans because it provides a new class of financial instruments to analyse for traders and it offers a new skill for crypto fans, who can now learn analytical tools such as the technical analysis and wave analysis.
With such developments, it’s not surprising that both the size of crypto watchers and the followers of technical analysis are increasing in their fan base.
Using the Wave Analysis to Analyse Bitcoin, BTC/USD
Wave analysis is actually the process of using the Elliott Wave (EW) Theory in analysing the trading instruments. The EW theory is usually applied on the trading charts. And just like any other technical analysis tool, the EW Theory also has guidelines and rules which traders and analysts should adhere to.
Traders and analysts should first take their time to learn the rules and guidelines before trying to apply the EW theory. You should first understand how to read and interpret the EW on the chart.
Below is a practice example of how the crypto traders and analysts can apply the wave analysis in setting up entry and exit points when trading or analysing the market prices.
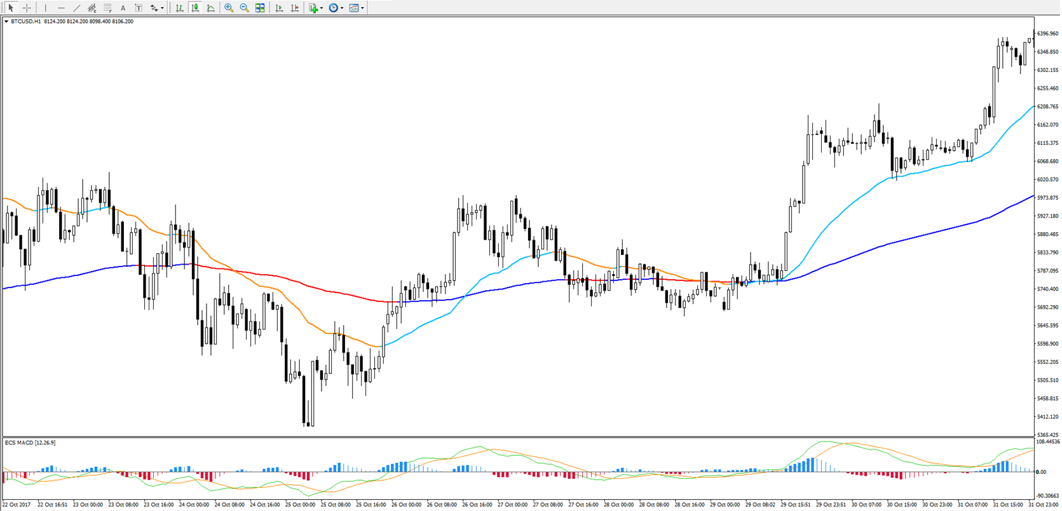
From the chart, it is visible that in November 2017, the prices of Bitcoin dropped quite dramatically in relation to the US Dollar from $7760 to below $5700. This is clearly visible on the 1H chart. Now let’s look at how the analysts and traders can use the EW theory to catch a continuation of the now established uptrend.
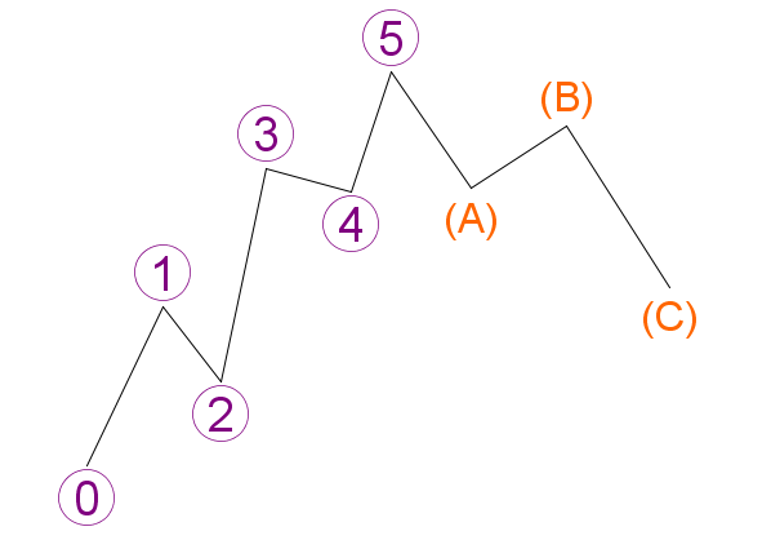
Firstly, to understand the chart, one will have to recognise that the wave patterns comprise of five (5) waves forming in the trend’s direction and three (3) waves against the trend. The waves formed are normally labelled as 1, 2, 3, 4 and 5. There is also an ABC correction on the opposite direction of the trend.
Now one of the rules of EW Theory is that the second wave (wave labelled 2) should at no time break the starting level of the first wave (the wave labelled 1). In short, this means if there is an uptrend, the uptrend price should never go below the level of the wave 1. Similarly, if there is a downtrend trend, the downtrend price should never move on top of the wave 1. When prices break these points, the wave 1-2 analysis is nullified and therefore an alternative method becomes a better option.
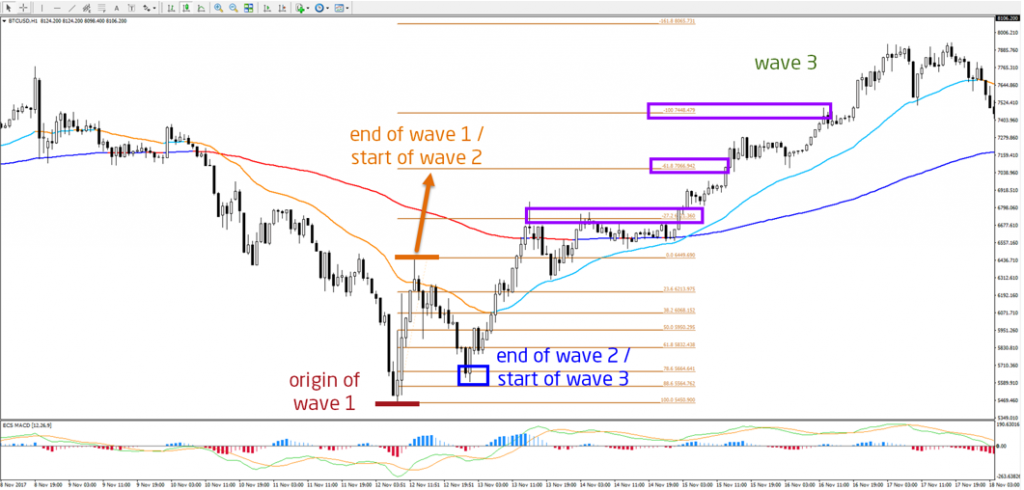
With this, EW analysts and traders should look at the BTC/USD 1H chart to determine when the first wave (wave 1) starts. Wave 1 is usually a price wave that is supposed to move in the same direction as the prevailing market price trend and should therefore move very fast compared to the counter trend price waves, which are usually corrective and irregular.
The traders and analysts should at all-time be on the lookout to ensure that they are able to note when the prices bounces at any support level and begins to follow the direction of the trend once again. This in most case shows an end of the downward retracement and the beginning of a new wave 1.
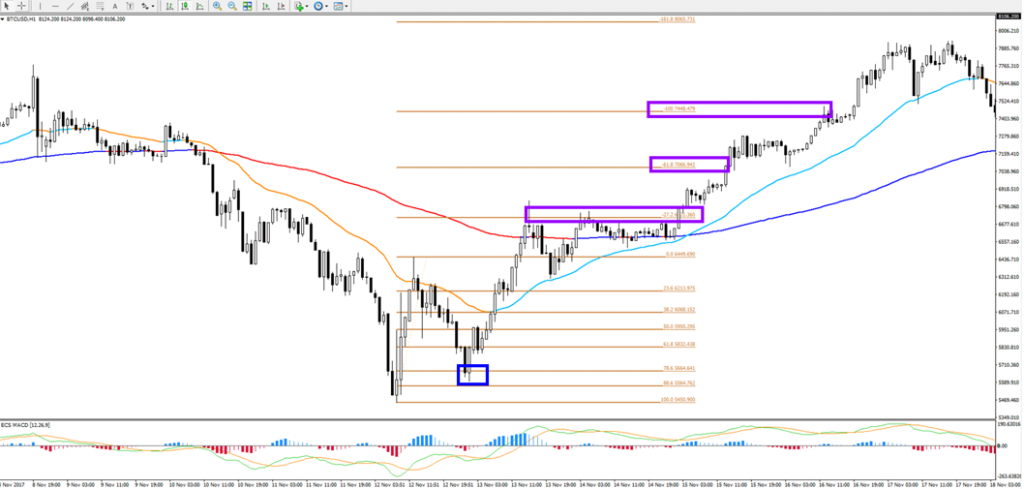
From here, the traders can now use the Elliott Wave Theory rule that says that the start of the wave 1 should not be broken if the market prices are in a wave 1-2. To do so, traders or analysts can use the Fibonacci retracement tool on the wave 1 (that is starting from bottom towards the top when the prices are in an uptrend) expecting the prices to bounce at the retracement levels so that there can be a trend continuation without breaking the bottom.
As in the above chart, using the strategy, the trader can have an entry at $5665 and use a tight stop loss (to act as the exit point) just below the bottom at around $5450 (which is not triggered) leading to remarkable upward move going up to $8000. Using this, the risk involved is around $215 which results to a reward of more than $2250.
Wave Patterns and Wave Analysis
We have only looked at one among many ways of using the wave theory especially the Elliott Waves rules and guidelines.
For the Bitcoin traders as well as the other cryptocurrency traders, the use of technical and wave analysis provides an intriguing technique of analysing price patterns for successful crypto trading.
With the current trends in the financial markets, the use of wave analysis on crypto currency trading proves to become more and more exciting with time.
Why do we say so?
If you look at the crypto price movements, you will realise that they form large and continuous price waves thus providing great trading opportunities for traders who choose to use the wave analysis.
Wish you successful trading,
Chris Svorcik

.


Leave a Reply