? BTC/USD Bearish Break of Triangle Pattern Aims for 5.5K ?
Subscribe
Bitcoin has crashed from a high near 20,000 down to below 7k. Will Bitcoin recover or is the cryptocurrency doomed to a downtrend?
BTC/USD
Weekly
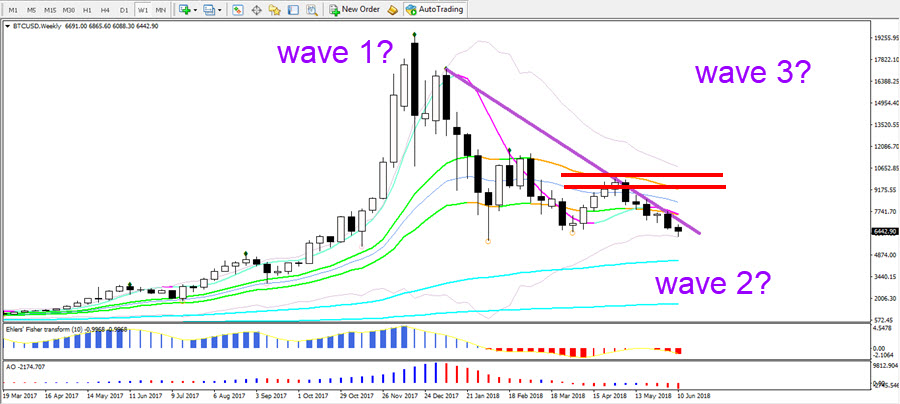
The long-term expectations of Bitcoin heavily depend on a trader’s own vision about cryptocurrencies in general. Personally, I remain bullish and believe that there is a fair chance that price is currently building a wave 1-2 pattern. A bullish wave 1 and a bearish corrective wave 2. Once the wave 2 correction is completed, then I’m expecting a bullish wave 3 to emerge. The wave 3 is more likely to emerge if price is able to break above the 21 ema zone (red lines). A wave 3 is usually at least 161.8% length of the wave 1 so considering that the first wave up was almost 20k, then the wave 3 should at the very least hit 50k.

Daily
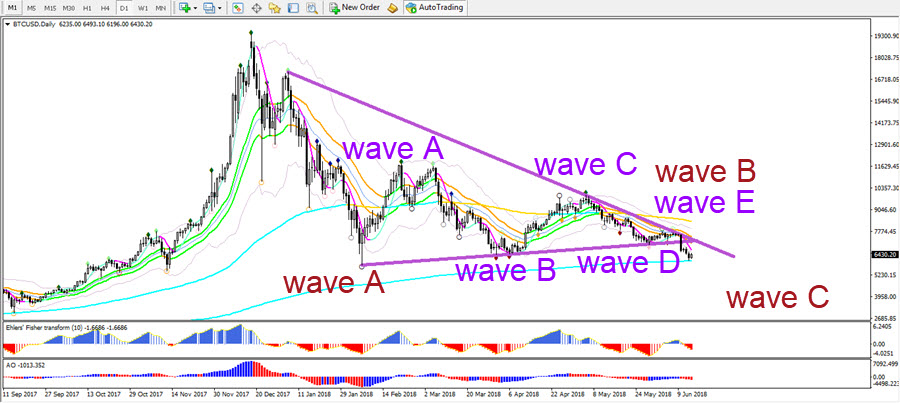
BTC/USD seems to have broken a bearish triangle on the daily chart after completing 5 waves forming an ABCDE pattern. The triangle could be part of a larger wave B correction, which fits within a potentially larger ABC correction. If that is indeed the case, then a larger bearish wave C could still emerge. A break above the resistance trend line and 21 ema zone could trigger a new rally and uptrend.
4 HOUR
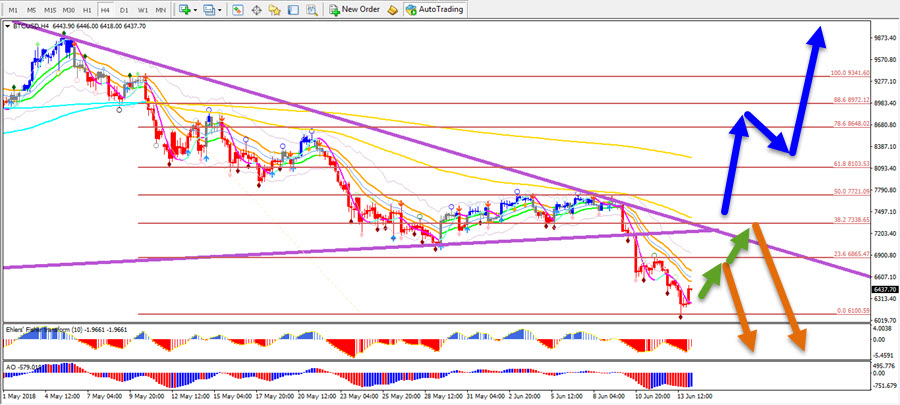
The 4 hour charts are not showing any bullish relief as yet. The bear flag pattern most recently broke and the ECS candles have indicated the bearish momentum via the red candles. No divergence is present between the bottoms either. Price remains in a bearish mode as long as price stays below the trend lines, 144 ema close, and 38.2% Fib. Only a break above the 544 ema and 61.8% Fib could change that perspective.
Good trading,
Chris Svorcik
Elite CurrenSea


Leave a Reply