❗️ Bitcoin Breaks $60k But Here’s Why $55-56k Zone Is Critical ❗️

Dear traders,
Bitcoin (BTC/USD) made a new higher high. Price crossed the $60k round level over the weekend. But price action is retracing swiftly this Monday morning.
What is in store for digital gold? Let’s review the current wave and chart patterns.
Price Charts and Technical Analysis
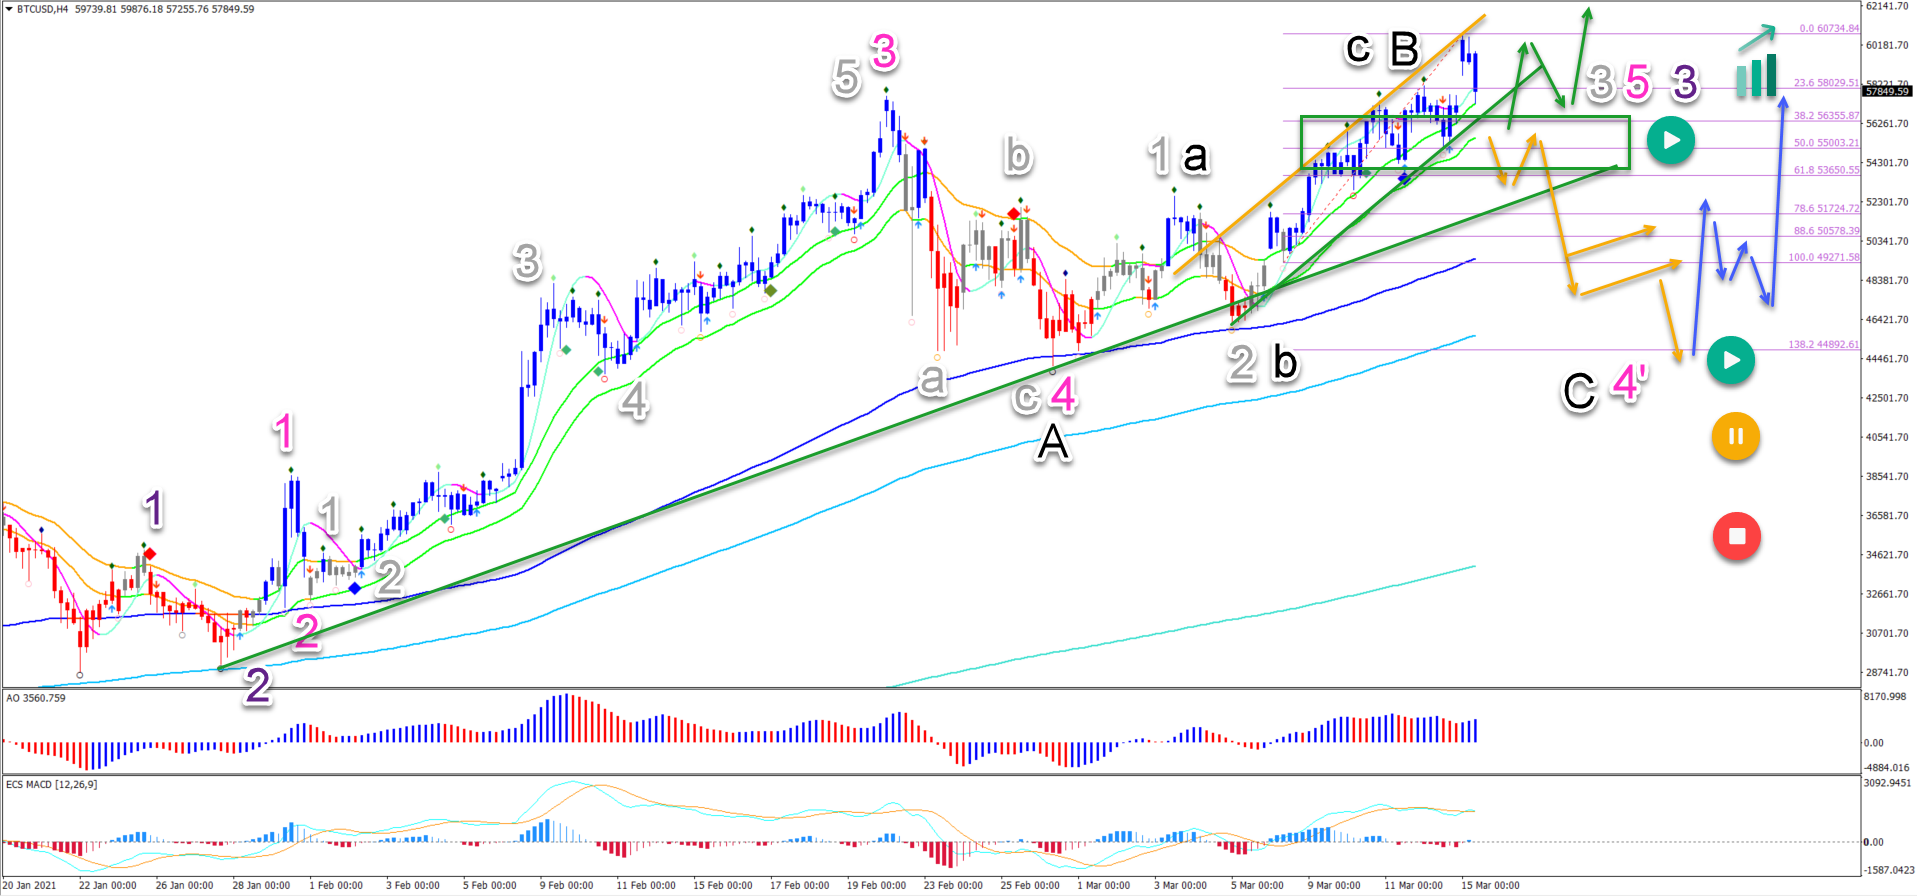
The BTC/USD bullish break is part of a strong uptrend channel. But the key and decisive factor is the support zone (green box). Here’s why:
- The support zone (green box) is extra strong because of the a) consolidation zone, b) the 21 ema zone, c) the shallow 38.2-50% Fibonacci levels, and d) support trend line (green).
- A bullish bounce at the support zone confirms that the bulls are fully in control (green arrows). An immediate uptrend continuation is expected.
- A bearish breakout (orange arrows), however, makes the bullish variant less likely. This could indicate that the wave 4 (pink) is still ongoing.
- With a wave 4’ (pink) developing, price action could be building a bullish abc (black) within wave B (black) of a larger ABC pattern.
- The bearish retracement is expected to unfold in 5 waves and aim at the previous wave A bottom and 138.2% Fib around $45-50k.
- A bullish trend is expected to restart at this support zone (blue arrows).
- At the moment, price action needs to respect the $55-56k support zone for the immediate uptrend to stay intact.
On the 1 hour chart, we can see multiple wave 3s developing as long as the pullback remains shallow. A price decline to test the Fib seems imminent (brown arrow). Let’s review:
- A bullish bounce at the Fibonacci levels (green box) could start a triangle pattern (green arrows) or an immediate uptrend (blue arrow).
- A bearish breakout places the uptrend on hold (yellow button).
- A deeper retracement invalidates the current wave outlook (red button). This means that more downside correction (orange arrows) is expected. A 5 wave pattern could indicate a wave B (black), complete wave C (black) of wave 4’ (pink), and reach the support (blue arrow).
- An immediate bearish breakout (red arrows) could indicate the start of a larger retrace.

The analysis has been done with the indicators and template from the SWAT method (simple wave analysis and trading). For more daily technical and wave analysis and updates, sign-up to our newsletter.
Good trading,
Chris Svorcik


Leave a Reply