🔥 Bitcoin Bearish Bounce Testing Deep 78.6% Fib Support 🔥

Dear traders,
Bitcoin (BTC/USD) failed to break the 21 ema resistance zone. Now price action is testing a key support decision zone again.
Will the support trend line (green) and deep Fibonacci levels stop the decline? Let’s review the Elliott Wave and Fibonacci patterns.
Price Charts and Technical Analysis
Bitcoin has extended its sideways range between $30 and $40,000 for another week. The correction is taking a long time to develop but that is common in wave 4s (pink):
- The correction is probably part of a wave B (orange).
- A break below the 100% Fibonacci level and bottom invalidates (red circle) the bullish Elliott Wave outlook.
- A bullish break (green arrow) above the 21 ema zone, 144 ema, and resistance trend line (orange) confirms the bullish rebound.
- A bullish ABC pattern could complete a wave C (orange) of wave B (grey) at the previous top.
- Ultimately, a larger ABC (grey) pattern could complete the wave 4 (pink) and a new uptrend could emerge for a wave 5 (pink).
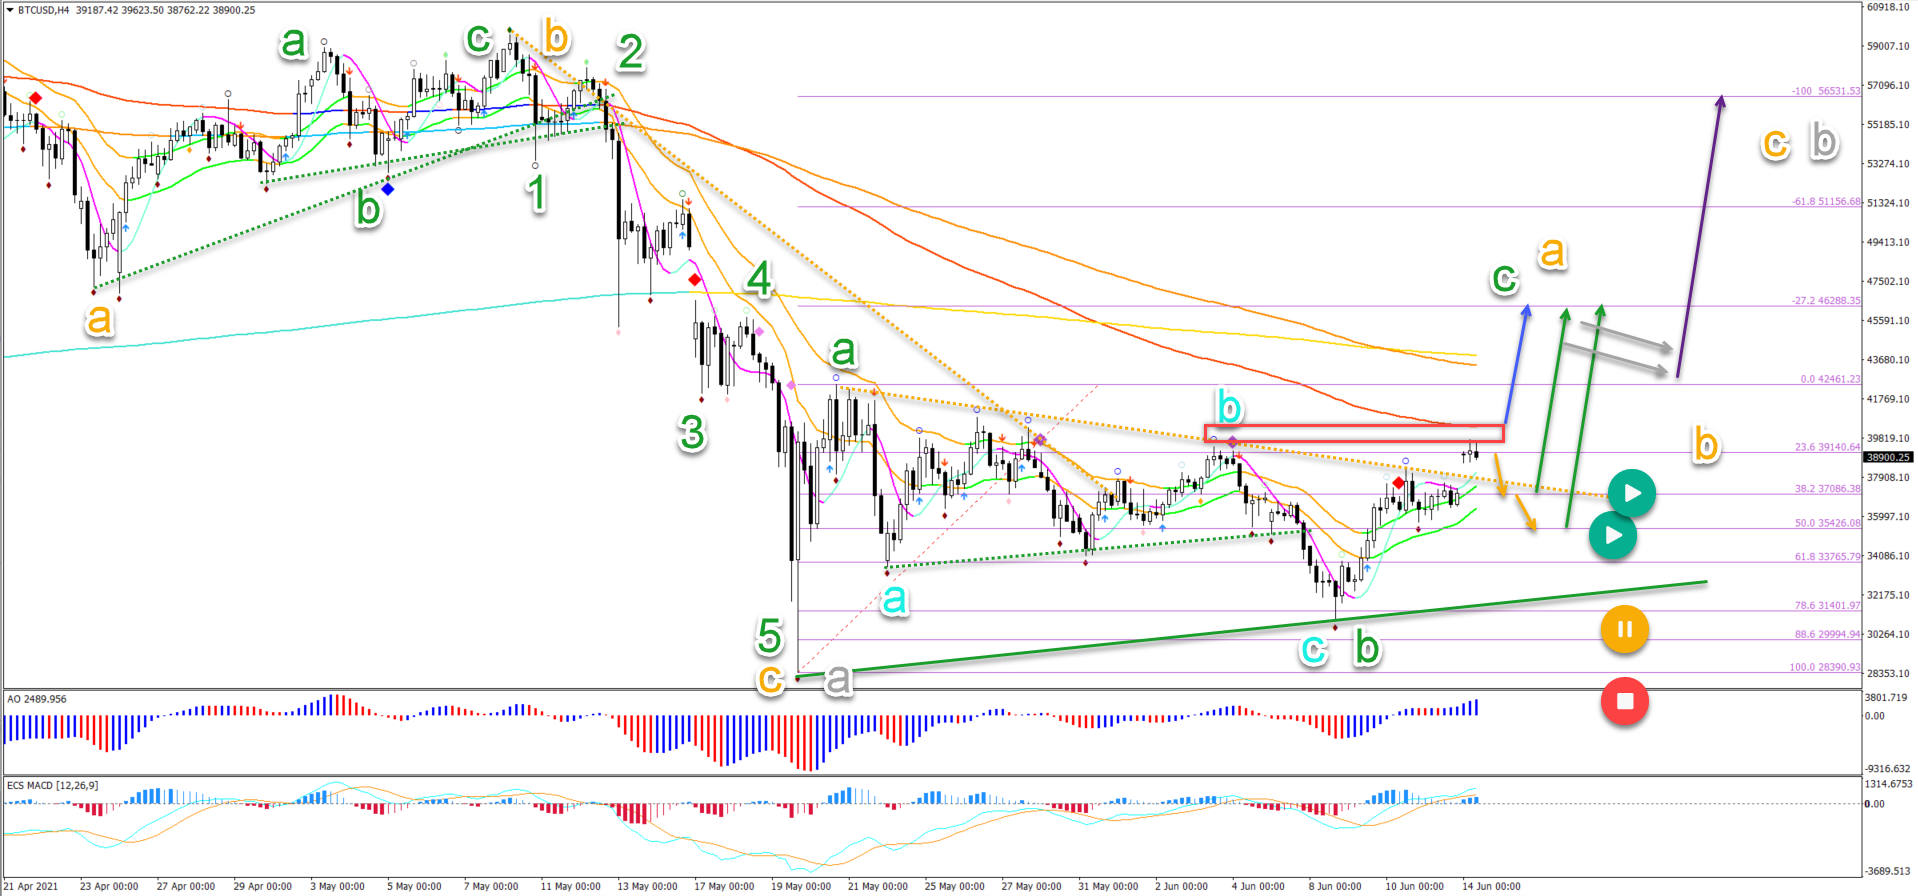
On the 4 hour chart, price action seems to be creating a contracting triangle chart pattern:
- A bearish ABCDE (blue) triangle pattern seems to be the most likely scenario.
- Why? The triangle pattern fits well with the expected market psychology where price is now expected to go sideways and not break for a while.
- The ABCDE (blue) could complete a wave B (green) pattern of a larger ABC (green).
- The alternative Elliott Wave scenario is a wave B2 (green) followed by a bullish ABC (black).

The analysis has been done with the indicators and template from the SWAT method (simple wave analysis and trading). For more daily technical and wave analysis and updates, sign-up to our newsletter.
Good trading,
Chris Svorcik


Leave a Reply