🔍 Gold: Long-Term Elliott Wave Analysis for Trading Year 2021 🔍

Dear traders,
Gold (XAU/USD) has made a massive bullish run in the year 2020. After reaching the -200% Fibonacci target, it has confirmed the development of a wave 3 rather than a wave C.
How far can the uptrend last and what targets? Let’s review.
Price Charts and Technical Analysis
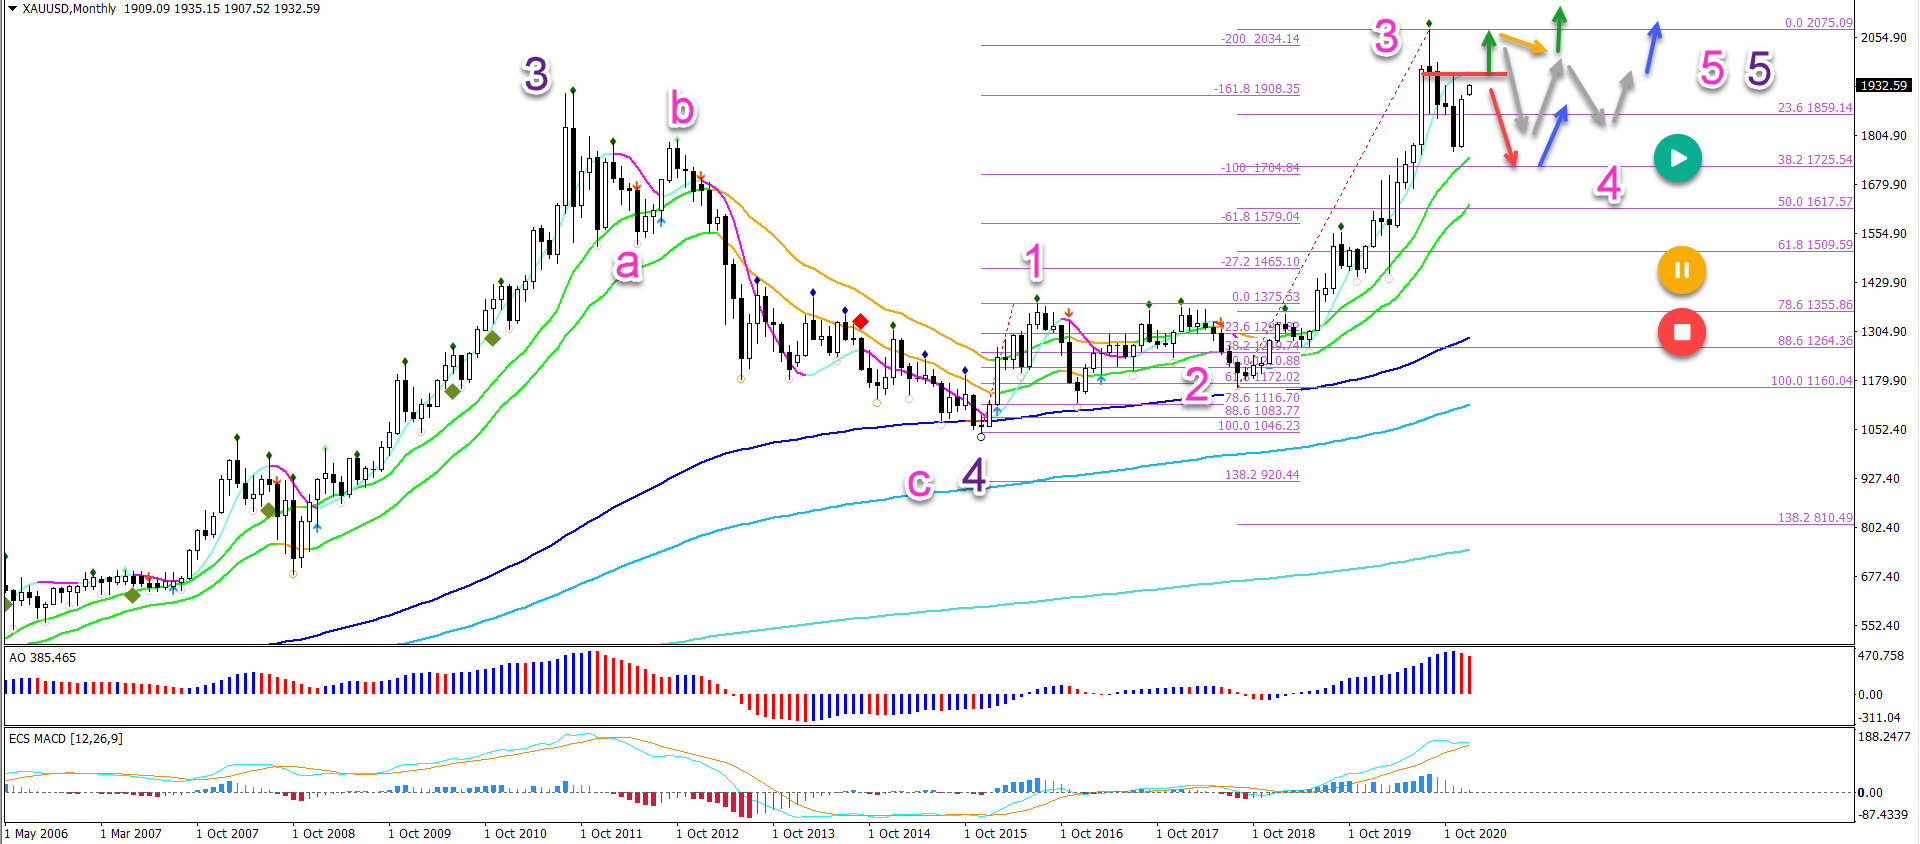
XAU/USD has not been able to confirm a new high in the past 4 months. Here are the key aspects from a timing perspective:
- The uptrend and wave 3 continuation (pink) still has the best odds in the first quarter of 2021.
- But a failure to break by March 2021 could indicate a larger retracement in wave 4 (pink).
A bullish breakout (green arrow) above the resistance trend line (red) could confirm the continuation of the uptrend. But a bounce at the top could start a larger triangle pattern (grey arrows). The main target zones are at $2,250 and $2,500.
A failure to break could indicate a deeper retracement towards the 38.2% Fibonacci retracement level. The uptrend remains favourite as long as price action stays above the 61.8% Fibonacci retracement level.
The analysis has been done with the indicators and template from the SWAT method (simple wave analysis and trading). For more daily technical and wave analysis and updates, sign-up to our newsletter.
Good trading,
Chris Svorcik


Leave a Reply