Automated Trading
Up to 650% yearly account growth based on over two years of live track record.
Performance
Max Historic DD
Platform
Targeted Yearly
Performance
Max Historic DD
Platform
Targeted Yearly
Performance
Max Historic DD
Platform
Targeted Yearly
A mixture of market structure research paired with technical and fundamental analysis, allows us (with a help of bespoke software) to trade news and other high impact events without ever breaching 20% DD.

Monthly Returns
Average, based on past performance.
Quarterly Returns
May diviate between 15%-140%.
Yearly Returns
Based on past performance.
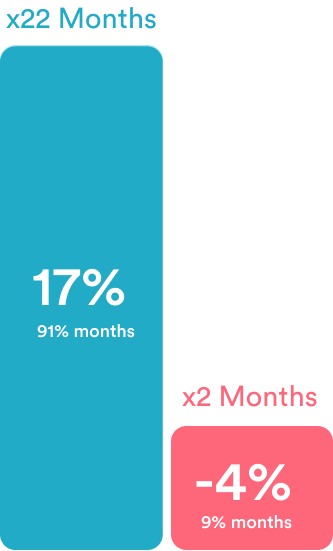
Drawdown
Only 2 loosing months out of 22.
| Net Deposit | Profit Sharing | Profit Sharing (BF🔥) |
|---|---|---|
| > $800 | 50% | 40% |
| > $5,000 | 45% | 35% |
| > $15,000 | 35% | 30%🔥 |
Existing partners
& sponsors


Existing partners
& sponsors