All Angles of Defining the Trend Properly (part 2)
Subscribe
Last week we kicked off a series of blog posts on the topic of TRENDS. Today’s focus is on how you are able to use moving averages in estimating the presence of a trend. Next time we talk about the direction of the trend and the strength of the trend.
Presence of a trend
Price can either be a) trending, b) reversing, or c) consolidating. The presence of a trend is needed for both trending and reversing price action; whereas a lack of a trend implies consolidation.
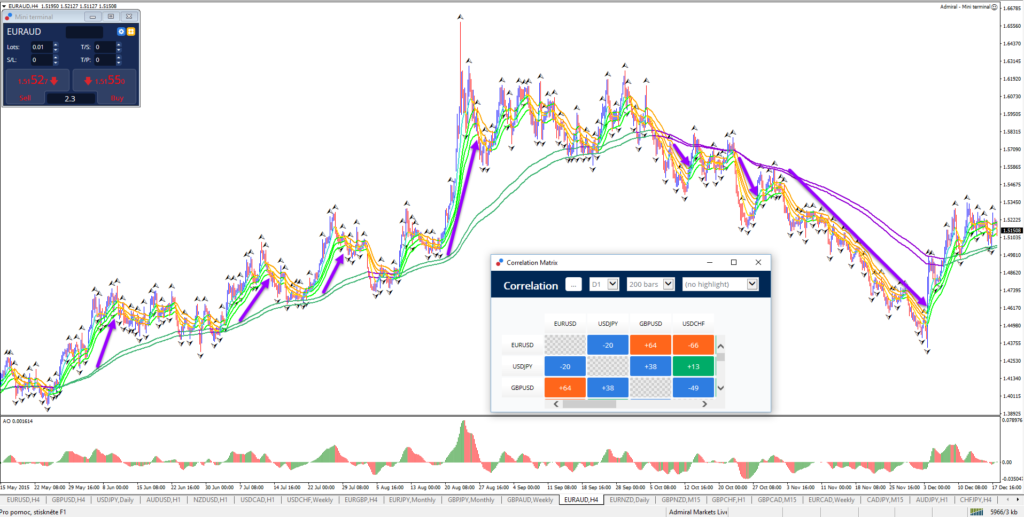
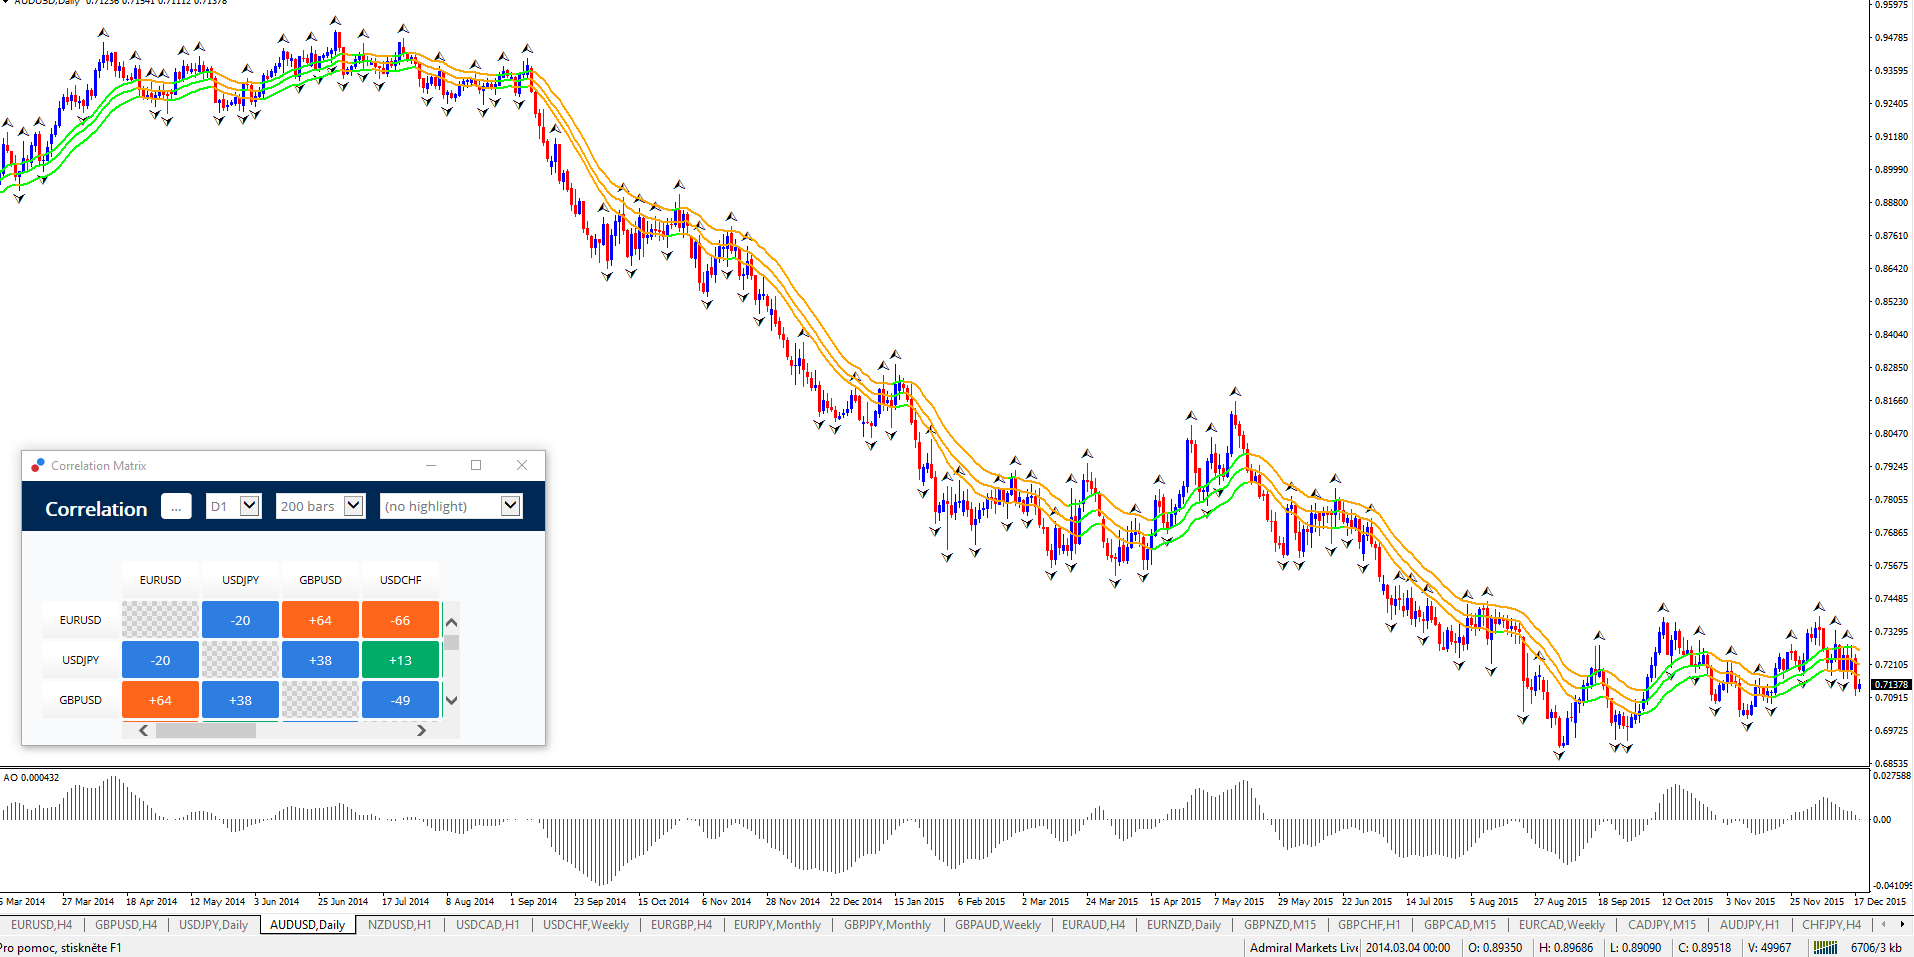
The presence of a trend can be simply spotted when using moving averages. In this case price is above a short-term moving average with the short-term moving average above the long-term moving average. Some traders even use a 3rd layer of moving average(s) and would use short-, medium- and long-terms on. In my opinion 2 sets of moving averages for the trend is sufficient and ideal.

Lack of a trend
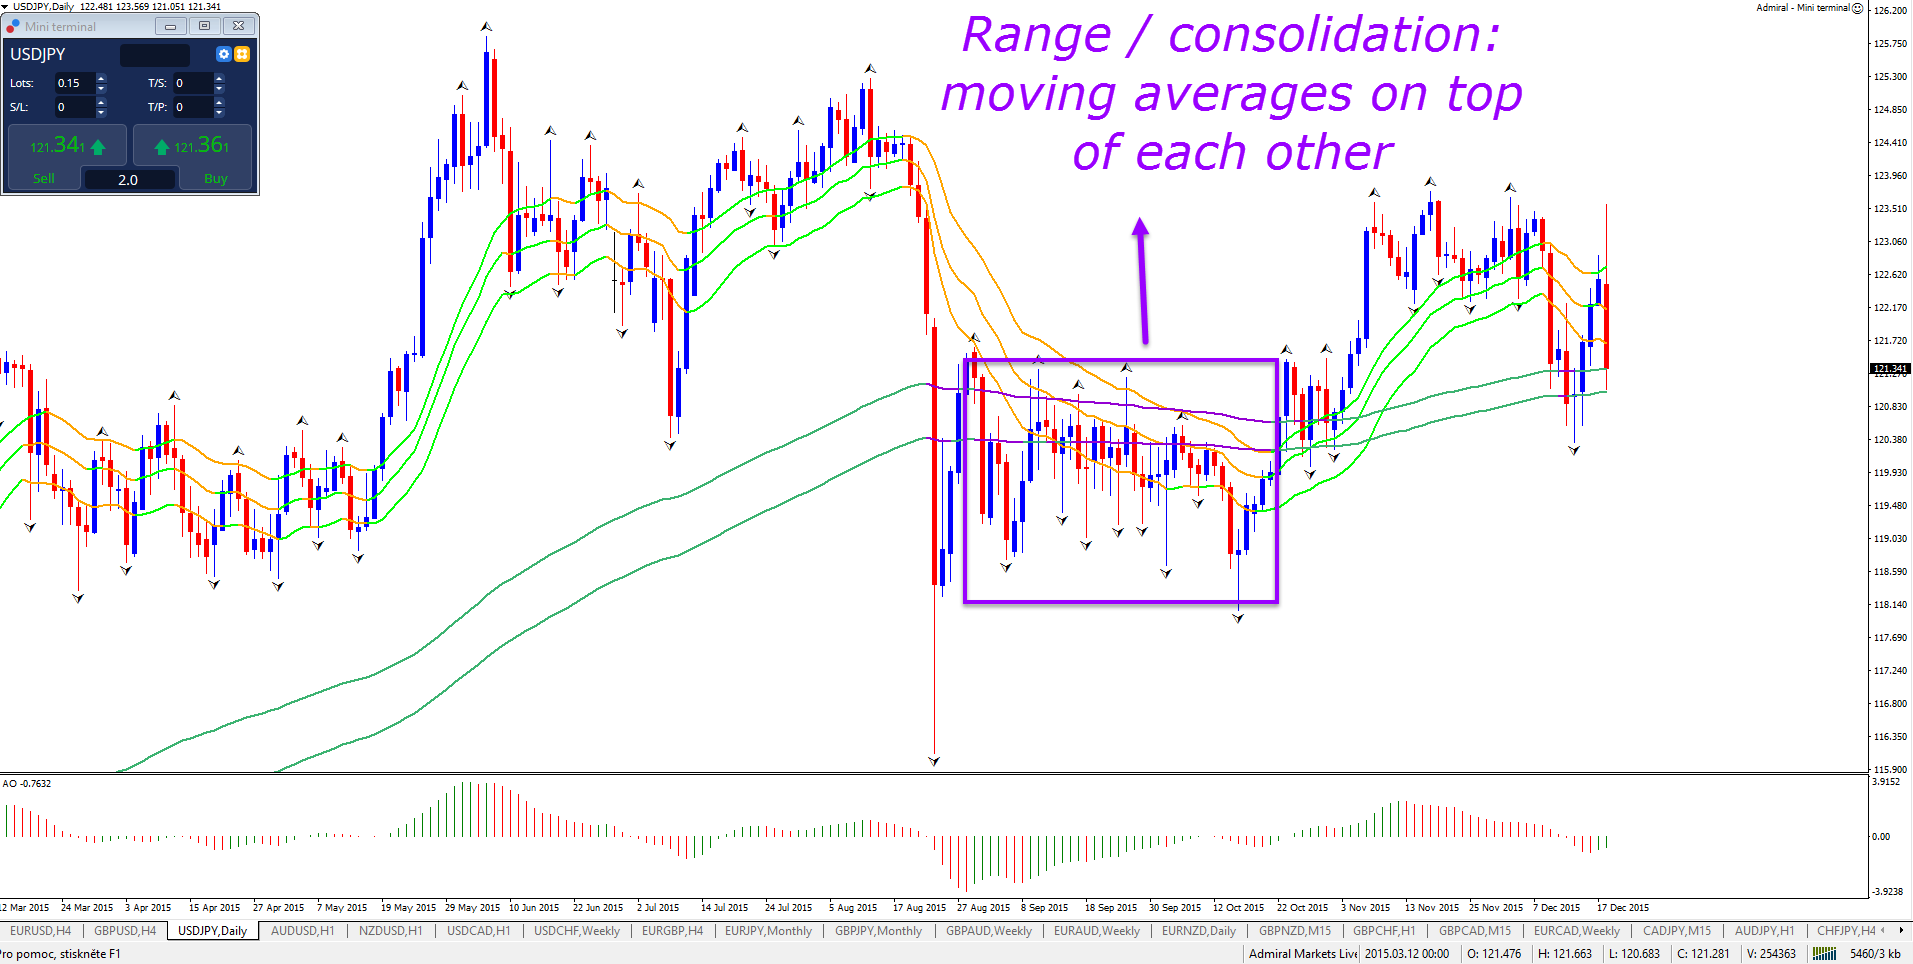
The lack of a trend can be simply spotted as well. This occurs when moving average are hitting or touching each other. A trend is always pulling the long and short-term moving averages away from each other so when the averages are on top of each other or touching each other, then the market is consolidating.
Spacing between averages
It is therefore important to see space between the moving averages. In fact, the bigger the space between the moving averages, the more momentum there is on the chart. When price has momentum it is able to move further away from the averages, which creates the gap between the averages.

Moving average numbers
Studies have shown that moving averages in general are all profitable, but that EMA’s (exponential moving averages) are more profitable than SMA’s (simple moving averages). In my opinion all moving averages will work very well. The most important part is to acquire and build up experience with the moving average numbers of your choice.
SHORT-TERM:
I personally use a set of 21 ema moving averages, which is the 21 ema close, 21 ema low and 21 ema high, which I call a band. The reason why I prefer a band of 21 ema’s is because it provides a zone of support and resistance. The reason why I use 21 is because: a) it’s a Fibonacci sequence level and b) it does a great job of capturing momentum bursts.
LONG-TERM:
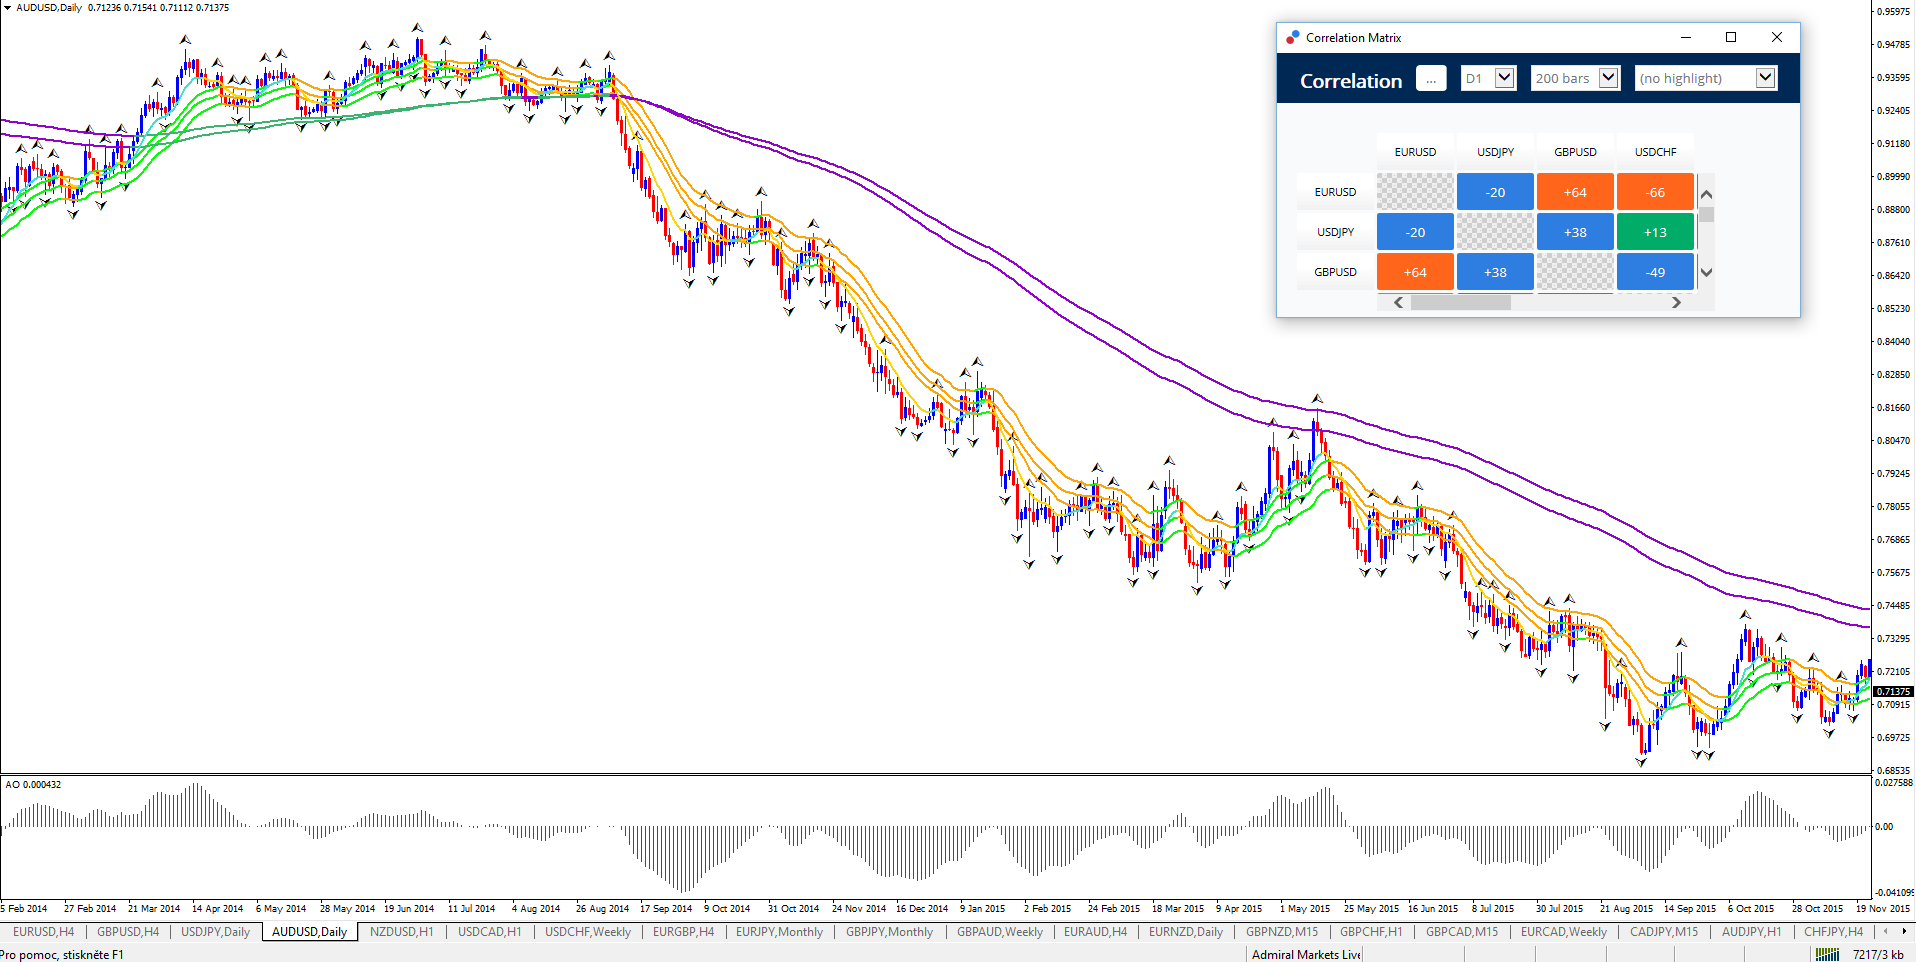
I personally use 144 ema close and 169 ema close, which is referred to by traders as the tunnel. These numbers are Fibonacci based numbers too. The 144 is a sequence number and 169 is derived from it too. Price tends to highly respect the long-term moving average as a spot where price either continues with the trend or reverses.
COMBINATION:
I like combining the 2 sets of 21 and 144 ema because it’s a flexible and trends are simple to spot. A clear trend is present when the 21 is above/below the 144. When the 21 is crossing the 144 a trend reversal is potentially occurring. And when the 21 ema is on top of the 144 ema, then a range or consolidation is taking place.
Momentum MA
Using a very short-term moving average is also a useful concept because it provides even more information about MOMENTUM. An 8 ema close for instance provides very important details about the strength or lack of price action speed in 1 direction. Anything from 3 up to 13 ema works well for this, and I often use 8 ema.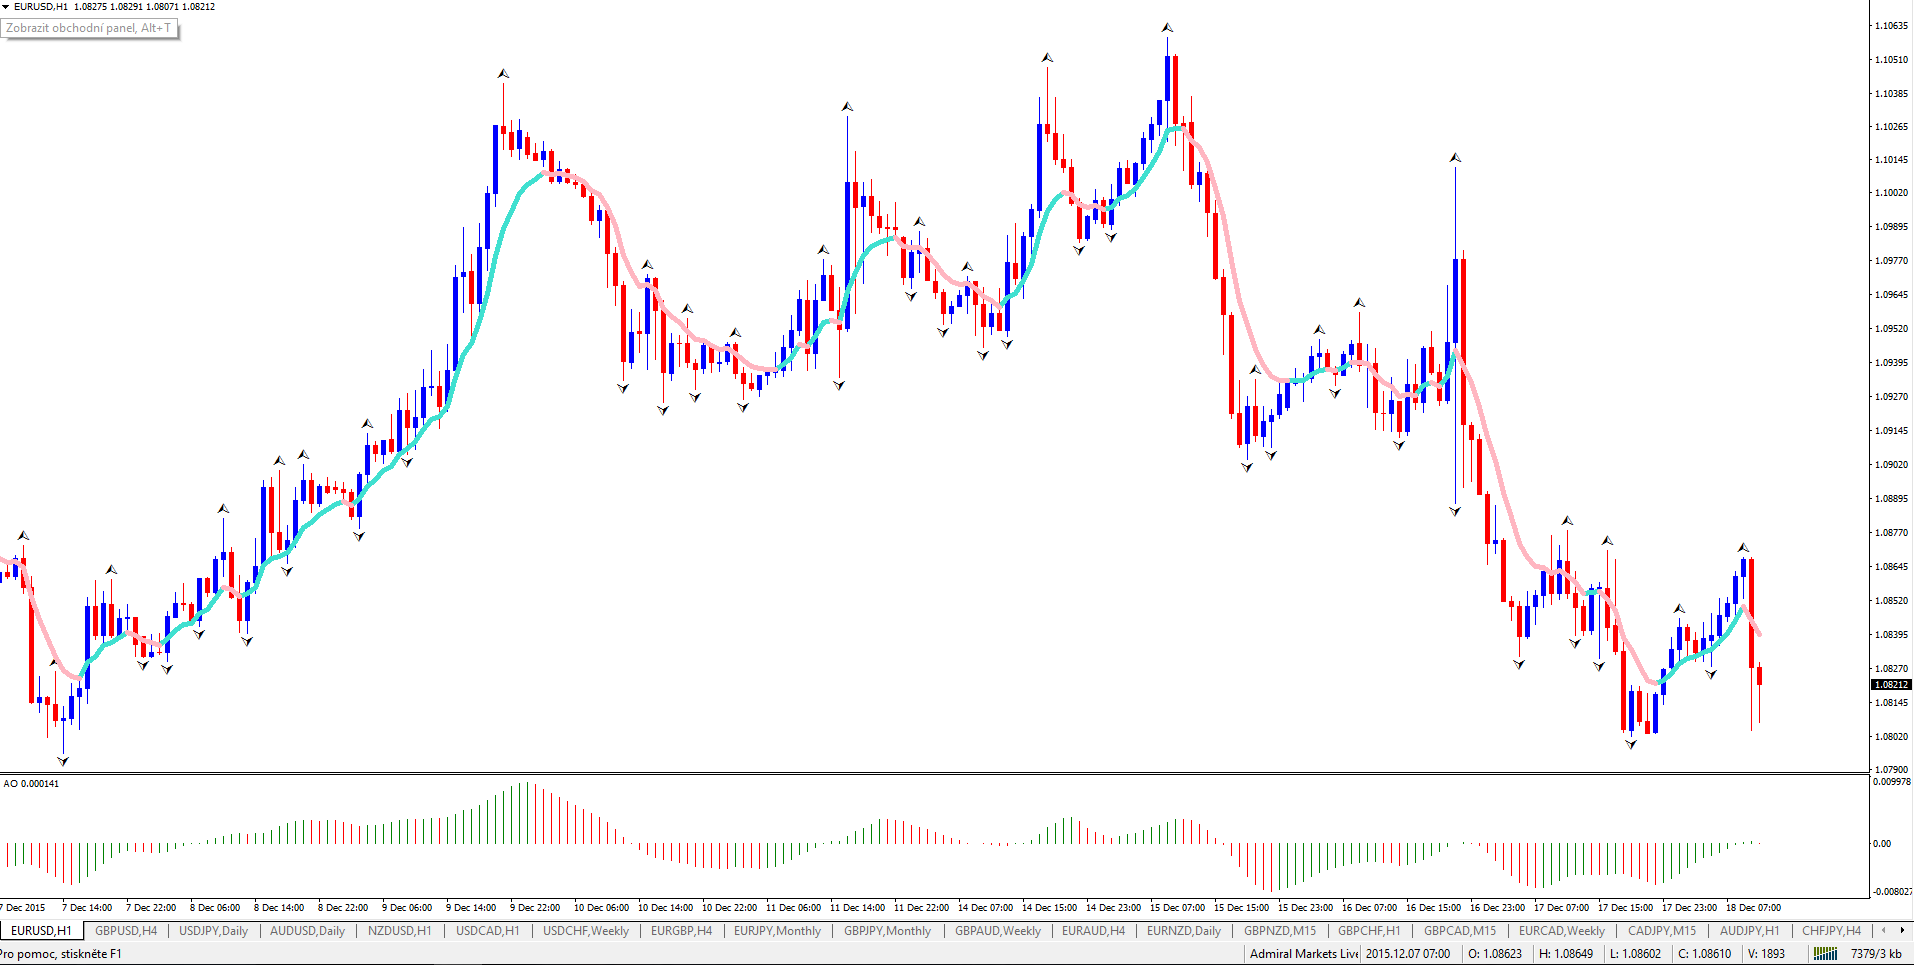
Conclusion
This is the 2nd step in a special education focus on trends. Next week we continue with measuring the direction of the trend and the strength of the trend.
Make sure to check out our SWAT SYSTEM AND COURSE which shows traders how to trade the Forex market.
[wysija_form id=”3″]


Leave a Reply